Do you need to catch the initial move to trade a breakout, or are there other ways of trading it? In this article we look at an alternative method using Fibonacci retracements.
When markets move, particularly in Forex, they move fast. We all have witnessed breakouts and have had the occasion to lament a trade that got away. The beginning trader sees breakouts as a way of riding a strong wave of volatility and providing a quick profit. The problem with the strategy of playing a breakout is that breakouts are technically unstable. They present difficult questions to answer, such as: How long will it last? Especially when there is an absence of news, the question of what caused it is difficult to determine. The better way to trade a breakout is letting the breakout occur and waiting for a subsequent pattern to emerge. Often a Fibonacci retracement pattern emerges, providing trading set-ups. Let's look at some patterns.
Such a breakout occurred in reaction to the Treasury International Capital Report on November 16 2005 at 9AM EST. This report tracks foreign ownership of US Treasuries and provides an important measure of global sentiment for the dollar. If foreign ownership of US Treasuries is perceived as trending down, this fundamentally weakens the attractiveness of dollar based assets and therefore is a bearish factor for the dollar. On the other hand, if foreign ownership of treasuries is increasing, then the underlying support for the dollar is stronger. Furthermore, if a particular report surprises the market, a breakout pattern occurs. Here is what happened.
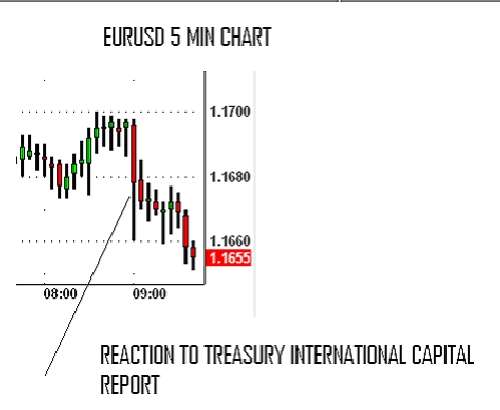
The market surged down on the EURUSD because the report provided data showing greater than expected buying of US Treasuries. Here is the latest table which can be accessed at: www.treas.gov.
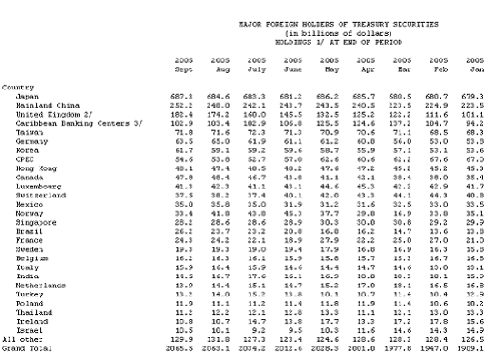
In reviewing this data, we can see that Japan, China, Britain and the Caribbean remain major buyers of US Treasuries amounting to $1224 billion dollars and comprising 59% of the 2.065 Trillion dollars! The 2005 rise of the US dollar is a consequence of the ability of the US to attract ownership of US treasuries. The day will come when the surprise is on the other side and it may be that this report will signal the end of the bull trend in the dollar when that happens.
But the trader does not have to read the report to trade the response to the news. By waiting for the market to react to the report, and then by watching for a retracement of that pattern, the trader can avoid the risks of trading the breakout and still obtain a trading opportunity.
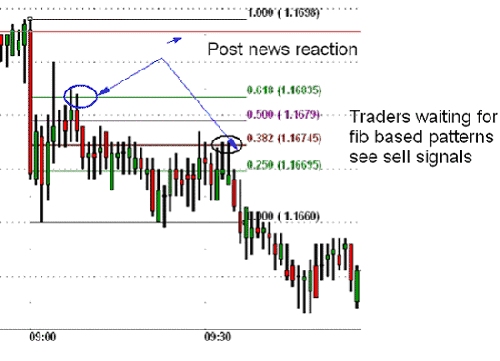
The following chart shows that the initial reaction to the TIC surprise report was down and the EURUSD proceeded to decline from 1.1698 to 1.1660 (48 pips). The price action then in 3 minutes temporarily retraced above the 61.8% line. We see that it fell back and tried again to test the 61.8% fib (1.16835). The second attempt and failure to move further up was a good entry area for a short.
The action tried to test the previous low at 1.1600 again several minutes later, bounced off it and then probed the 38.2% line. The failure there was another selling opportunity. We can see that within 1/ 2 hour of the TIC report, those that missed the initial break down had two more good entry potentials for selling. Next time you consider a breakout trade, the strategy of letting it break may give you more opportunities and more reliable set ups.
When markets move, particularly in Forex, they move fast. We all have witnessed breakouts and have had the occasion to lament a trade that got away. The beginning trader sees breakouts as a way of riding a strong wave of volatility and providing a quick profit. The problem with the strategy of playing a breakout is that breakouts are technically unstable. They present difficult questions to answer, such as: How long will it last? Especially when there is an absence of news, the question of what caused it is difficult to determine. The better way to trade a breakout is letting the breakout occur and waiting for a subsequent pattern to emerge. Often a Fibonacci retracement pattern emerges, providing trading set-ups. Let's look at some patterns.
Such a breakout occurred in reaction to the Treasury International Capital Report on November 16 2005 at 9AM EST. This report tracks foreign ownership of US Treasuries and provides an important measure of global sentiment for the dollar. If foreign ownership of US Treasuries is perceived as trending down, this fundamentally weakens the attractiveness of dollar based assets and therefore is a bearish factor for the dollar. On the other hand, if foreign ownership of treasuries is increasing, then the underlying support for the dollar is stronger. Furthermore, if a particular report surprises the market, a breakout pattern occurs. Here is what happened.
The market surged down on the EURUSD because the report provided data showing greater than expected buying of US Treasuries. Here is the latest table which can be accessed at: www.treas.gov.
In reviewing this data, we can see that Japan, China, Britain and the Caribbean remain major buyers of US Treasuries amounting to $1224 billion dollars and comprising 59% of the 2.065 Trillion dollars! The 2005 rise of the US dollar is a consequence of the ability of the US to attract ownership of US treasuries. The day will come when the surprise is on the other side and it may be that this report will signal the end of the bull trend in the dollar when that happens.
But the trader does not have to read the report to trade the response to the news. By waiting for the market to react to the report, and then by watching for a retracement of that pattern, the trader can avoid the risks of trading the breakout and still obtain a trading opportunity.
The following chart shows that the initial reaction to the TIC surprise report was down and the EURUSD proceeded to decline from 1.1698 to 1.1660 (48 pips). The price action then in 3 minutes temporarily retraced above the 61.8% line. We see that it fell back and tried again to test the 61.8% fib (1.16835). The second attempt and failure to move further up was a good entry area for a short.
The action tried to test the previous low at 1.1600 again several minutes later, bounced off it and then probed the 38.2% line. The failure there was another selling opportunity. We can see that within 1/ 2 hour of the TIC report, those that missed the initial break down had two more good entry potentials for selling. Next time you consider a breakout trade, the strategy of letting it break may give you more opportunities and more reliable set ups.
Last edited by a moderator: