We all have seen tons of indicator based systems come and go. Anyone who has been around in the forums long enough know this as a fact. I can keep on going, nevertheless my goal here is to show you how you can trade without indicators and be successful which is the bottom-line of course.
Let me introduce " No Indicators - No Worries System " aka "Ni-Now" pronounced "nee-noew"
We are looking for:
These three questions is the key to trading successfully. To answer these question you need to follow the three steps I mentioned above. Once you setup the charts accordingly, start looking at the price like you are reading a book. Charts tell a story and as a trader we need to learn to interpret their meaning.
You must be thinking it is all words and no action. Bookmark this thread and come back to see the charts that I'll post in real time before the market moves. You will have to see it to believe it.
Regards
Victor
Let me introduce " No Indicators - No Worries System " aka "Ni-Now" pronounced "nee-noew"
- First thing first, remove all indicators from you charts. I mean ALL indicators, not even moving averages.
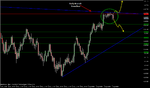
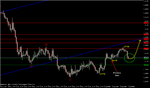
- Second, Open Weekly timeframe and Draw Trendlines
- Third, Do the same with Daily and 4 hour
We are looking for:
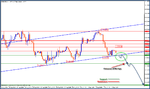
- Where the price currently is?
- Where it is heading towards?
- Where will it stop?
These three questions is the key to trading successfully. To answer these question you need to follow the three steps I mentioned above. Once you setup the charts accordingly, start looking at the price like you are reading a book. Charts tell a story and as a trader we need to learn to interpret their meaning.
You must be thinking it is all words and no action. Bookmark this thread and come back to see the charts that I'll post in real time before the market moves. You will have to see it to believe it.
Regards
Victor