captaincol
Junior member
- Messages
- 37
- Likes
- 1
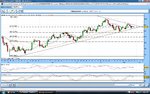
I have noticed that gold has been in an upward trend since last October. Placing a Fib over the top of this ralley shows that we are heading for the 23.6% line which is also where the triangle apex is. I think this would be a crucial breaking point, which ever way gold moves, into what price action we can expect from gold. The triangle patterns is a continuation pattern and with everyone expecting a higher move in gold (medium term) this could well be on the cards.