Multitimframe trading strategy for MT4.
Description of the strategy Professional_2.
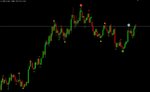
***** The basis of the strategy is a combination of indicators Brilliant Reversals on D1. The type of indicator labels is shown in Figure 1. Its difference from the Professional strategy is that the periods of the indicators are changed in order to minimize the consequences of redrawing the indicators. Here the periods of indicators are increased from 20 to 23 and are: 10-23-65 and 5-23-65. On the timeframes M15, M30, H1 and H4 are placed 2 movings, "borrowed" from the strategy of the Puria method. The periods of the removals are recalculated depending on the timeframe and are given in the table.
ТФ М15 М30 Н1 Н4
Period 1 150 75 38 9
Period 2 170 85 43 11
Recalculation of periods is necessary in order for the excesses of the removals to coincide in time at different timeframes, thus creating a holistic picture of the development of events.
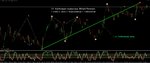
Still here indicators STR_AlertSignal are applied which also change from the timeframe to the timeframe. The reason for the recalculation is the same as in the previous case. They are used instead of Brilliant Reversals, which allowed to reduce the load on the trading platform. The type of indicators is shown in Figure 2. The strategy is simple and understandable. The Brilliant Reversals indicators on the D1 are informational in nature. Most likely their (marks) the final formation will occur on Monday, Wednesday or Friday. When the price starts moving in the opposite direction: the candle (bar) has separated from the Brilliant Reversals indicator on D1, we start to look for deals. For this we switch to the younger timeframe (H4, H1, M30 or M15) and wait for the price to cross the removals corresponding to the strategy of the Puria Method.
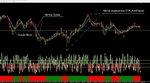
The price in this case must also be higher (lower) Pivot point indicator Forexometry. That's all. Zones of sales and purchases are presented in Fig. 3.
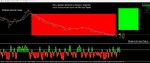
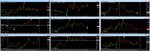
To select a financial instrument for making deals, you need to create several profiles: EUR profile; profile GBP; profile AUD, etc., turn on mosaic windows, switch all financial instruments in the profile to D1 and apply the "market review" template. The profile type is provided in Figure 4.