Market Moving Sideways

mike_g4

Junior member
Messages
13
Likes
2
Hi all,

I have a system that i'm using which works ok when the market is going up or down, but it loses money when it goes sideways and usually quiet a lot, what i need is some indicator which tell's me that the market is looking like it may be a sideways kinda day. Can anyone help me with this please.

Does anyone know how often (previously) you would expect to see sideways day movements. Is it a regular thing or is it more so normal to have an up day and a down day.

Any advice much appreciated.


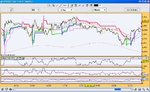
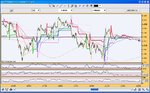
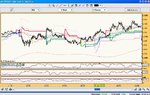
I have some graphs which shows sideways movement with 1 graph showing high volatility - hope I can get some help.

Kind Regards
Mike
 

Attachments

  • day_trade_030108.jpg
    day_trade_030108.jpg
    150.6 KB · Views: 405
  • day_trade_070108.jpg
    day_trade_070108.jpg
    154.2 KB · Views: 395
  • day_trade_140108.jpg
    day_trade_140108.jpg
    148.1 KB · Views: 470
Mike,

A sideways market (or apparent lack of movement) is relative to the instrument and time-frame. Intra-day, nearly all instruments - indices, bonds, fx - have sufficient trading ranges. However, the longer your time-frame (and assuming your looking only at the closing prices), this appears to reduce. It is rarely sideways.

Grant.
 
Maybe consider trading more volatile markets, this may help avoid markets that trade in a tighter bandwidth as your system may need those swings to generate good profits.
 
thanks for your reply.
I spreadbet on the S&P500 using a 1 min chart, making anthing between 2-8 trades a day.

I have discovered with the market two types of sideways movement.
1. where the market (S&P500) is low volatility and has a tight/short trading range
2. where the market has high volatility where the trading range is increased but is extremly chopppy.

I have a signal which shows me how to see point one as there are many but point two is difficult to foresee.

GRANTX - I hope your right in stating that we rarely have sideways movements :eek:)

Many Thanks
Mike


hey Mike, hope you dont mind me asking.?- but why are you trying to spreadbet in a SIDEWAYS range ? - (get jammed in, CONSTANT stress about the price)
why not sit on the sidelines(cash rich) and wait until it TRENDS and then jump on ?

:-0
 
I have a system, that is plagued by the same problem.

Only thing that I can observe that would make a good indicator, is kind of "market nervousness". If we are talking about intraday data, one would need to measure "shadowing" of the 5' (or 10', 15') bars. When intraday bar shadowing is high, market contains no emotion, it bide its time in a consolidation and should be avoided by the brakeout systems. Contrary, as soon as bar "shadowing" is reduced, markets become easily movable and they are ready for brakeouts.

But how to program this?

cheers, dejan
 
The only useful thing I have found is historic volatilty but I have only found this useful to show when the volatility is low (at a certain point where the market moves sideways). If volatility is high and moves sideways the historic volatility doesn't show any difference from a range day or trend day this is my issue :(
 
hey Mike, hope you dont mind me asking.?- but why are you trying to spreadbet in a SIDEWAYS range ? - (get jammed in, CONSTANT stress about the price)
why not sit on the sidelines(cash rich) and wait until it TRENDS and then jump on ?

:-0

This is my whole point, If I new when it would go sideways in to range territory I would do exactly that sit and wait until it break into a trend, but I don't know when this happens so I have to bare with the losses when the market is ranging. So far the systems outweighing the losses but it is stressful watching the range days. For instance I can be 20 points up on the S&P on a trend and then it can turn in to a range for the last few hours and I'll lose all the profits :( not good. If only i had something to tell me it's going to range for a few hours .....

Mike
 
There is one indicator, but it would be very difficult to back test. This is how it works:

1) market spontaneously caves in.
2) non-financial media starts writing about big event in the markets. For example, event has reached BBC's main website front page.
3) Big moves persist for about a week.

Problem is backtesting.

cheers, dejan
 
Top