Josb

daiwa

Newbie
Messages
9
Likes
0
How about JOSB clothing guys ?

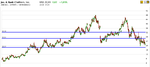
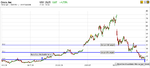
I don´t think we can go much further with these mad numbers, allmost 90% of company shares are shorted (borrowed). PE Ratio stands as 8, allmost the same as Crox does. I had found that diagonals in bear market can be very lazy to take move upside, but should this stock have extra powerfull support located at fib .618% ? In elliott wave terms we might have good chance to make a handshake with new impulse wave 3 - which is allways most powerfull. I don´t usually read much daily trading magazines, but noticed that Barrons has wrote something negative about their inventory some time ago.

(I made a few charts to view them full size just click them if interested)

Elliott Wave & Fibonacci Charts

Thoughts & Arguments & Comments ?

Regards,
-D
 
The overall picture is bearish. For the intermediate term a range between 18-26 is most likely.
 

Attachments

  • JOSB.png
    JOSB.png
    29.9 KB · Views: 180
Interesting,

I wonder if my CROX charts is also bearish for you ?

It´s pretty easy call to say stock will stay between 15-25 $, why not increase it between 5-125 $ range then missing only scenario that sideways might be also possible - to be fully disclaimer protected view :LOL:

This bearish stock is up again +5% today and haven´t take my lunch yet :)

Regards,

Elliott Wave & Fibonacci Charts
 
allmost 90% of company shares are shorted

How is that possible as there is a limit on the total percentage that can be shorted often around only 20% of total shares.


Paul
 
Last edited:
I wonder if my CROX charts is also bearish for you ?

It´s pretty easy call to say stock will stay between 15-25 $, why not increase it between 5-125 $ range then missing only scenario that sideways might be also possible - to be fully disclaimer protected view :LOL:

This bearish stock is up again +5% today and haven´t take my lunch yet :)

Regards,

Elliott Wave & Fibonacci Charts

Simple. I don't see evidence that bulls have made their case to bring JOSB up from here permanently. I'm a trend trader so I see things slower. What I'm referring to is the overall theme of that stock from a very objective standpoint. It could be the bottom, maybe not. I never call tops or bottoms because it's stupid to do so.

In a way my analysis agrees with your call, doesn't it? Since it's in a range, the risk to the downside is pretty small. And reward to $26 is pretty big. Easy as that. Just by reading price action. And history tells me that this is the most likely scenario.
 
CROX's picture looks like this and this is how it would be traded objectively.
 

Attachments

  • CROX.png
    CROX.png
    34.1 KB · Views: 188
Jos.A.BANK, JOSB

There´s so many way to work in the market as there´s individuals. Some follow trends, but you´re also szeezed badly when trend ends if you don´t see it and this was the case also in here also not to mentiond year change, I wonder when your signal informed that market trend has changed, if you saw that on february it make terrible job for your portofolio performance. Remember that there´s actually very few days during the year when most of the increase for prices are done, I remember read it from somwhere it´s about 15-20 days.

Crox came up since +25% and that´s 5 dollars!. It´s taking now back a bit, but JOSB is now out of your previously given range allready, up today -+20%. It also came up all week and everyday even when market had negative days....perhaps trend technicians see it as a change, but I am going to sell my position in next 5 days.

Btw. I am not aware of such a restriction that SEC limist how many stocks can be borrowed (shorted). Perhaps it´s changed since ? Uptick shorting rulez changed also not so long time ago to be the same as there were 8 years ago.

Another thing is that I do use elliott wave technology and I don´t think it´s trendfollower tool, pretty opposite actually. It´s master tool if one looking where price & time (the trend) will change and why.

Regards,

Daiwa
Elliott Wave & Fibonacci Charts

=========================================================================

JoS. A. Bank Clothiers, Inc. (JOSB), a Men's clothing retailer, announced financial results for fiscal 2007, reporting a net income that increased from the previous year on higher revenues. After the announcement of results, the company's stock surged more than 15% on the Nasdaq.

JoS. A. Bank Clothiers's fiscal 2007 net income increased to $50.17 million or 2.72 per share from $43.22 million or $2.36 per share in the prior year. On an average, six analysts polled by First Call/Thomson Financial estimated the company to earn $2.66 per share for the quarter.

The company said fiscal year 2007 contained 52 weeks and fiscal year 2006 contained 53 weeks. This is in line with the National Retail Federation's 4-5-4 week calendar.

Net sales for the year rose 10.5% to $604.01 million from $546.39 million in the previous year. Wall Street analysts expected the company to post revenues of $605.63 million for the quarter.

For the 52 weeks of fiscal 2007, Direct Marketing sales increased 13.1%, compared to the first 52 weeks of fiscal year 2006. Comparable store sales rose 3.8%.

The Hampstead, Maryland-based company's fiscal 2007 gross profit grew to $378.65 million from $338.44 million in the same period a year ago.

Total operating expenses were $295.90 million, up from $265.34 million last year, while operating income climbed to $82.75 million from $73.10 million in the prior year.

The company's total cash and cash equivalents were $82.08 million as of February 2, 2008, compared to $43.08 million as of February 3, 2007.
 

Attachments

  • josb.gif
    josb.gif
    37.2 KB · Views: 171
Last edited:
Top