lurkerlurker
Senior member
- Messages
- 2,482
- Likes
- 150
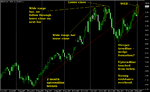
From the way I am reading the chart, if today has no follow through north we'll see a pullback of $5 or so. We have tested this resistance a few times now, and on wide ranging bars with a lack of follow through the following day price is rejected. We may also be forming a bearish wedge. We made new intra day highs, however we could not close at a new high. Further, I didn't see $100 print on the electronic contract, which to me indicates that a floor trader purposely paid too much for a contract in order to trigger the $100 print.* This just seems a little fishy to me.
I'm aware that the USD is weak and political tensions are contributing to higher oil prices. However, I'm pretty sure a lot of this is speculative excess and there will be a shakeout move down to stop out those who bought near $100, before we take off again from support somewhere around $95.
Inventories tomorrow might just spark the move one way or another. My plan is to wait and see how the market reacts to the news. If we break $100.50 on volume with decent momentum and close near the highs, I'll consider if it is a valid breakout. Otherwise, if we have a spike up on the figure I'll be looking to short the first sign of weakness. If we have a spike down, and substantial buying does not come in very very quickly indeed I'll also consider a short position.
* -either that, or I don't know enough about the futures markets. Surely if the electronic high was 99.85 or so it would be better buying there than paying $150 per contract extra. Unless this guy was doing some serious size and preferred to use the pit - even then as far as I am aware the pit and electronic contracts are fungible, so why would the pit front month be trading 15c higher than the electronic? Could someone who knows what they are talking about please explain why there was a $100 print reported from the floor which was not mirrored on the electronic platform? Did someone pay too much on purpose to make news?