Yes greed is bad, just am after an indentation that I can trust to get some points in the bag, after all the costs.....
😀 Aren't we all!
Yes greed is bad, just am after an indentation that I can trust to get some points in the bag, after all the costs.....
Would you sell BS's indicator in your chat room (Your Vendor badge does say your have a chat room?):whistlingBlack Swan, what is this indicator that you use,
Getting in is easier than getting out, and I a fed up of looking at a chart of the end of the day and thinking ahhhh why did I not hold...
Black Swan, what is this indicator that you use,
Getting in is easier than getting out, and I a fed up of looking at a chart of the end of the day and thinking ahhhh why did I not hold...

Hi there,
I am looking an indicator that helps you stay in an uptrend, and smoothes out down blips in an otherwise uphill trend, day swinging the FTSE btw.
I like to keep the date on the MID
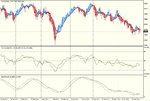
Other than slowing down the MCAD, and Stoc Ssl I cannot think of any other indicators.
Am I right in staying that they are all pretty much the same, MA, MCAD, RSI ect.. and work of averages.
Thanks
Hi Monkey.
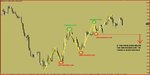
Why don't you keep it simple? Just follow the price and higher lows on your desired time frame. If there is no violation of the last higher low - up trend is there.
It’s based on a cliché: ‘Trend is your friend apart from the bend at the end’
Hi Monkey.
Why don't you keep it simple? Just follow the price and higher lows on your desired time frame. If there is no violation of the last higher low - up trend is there.
It’s based on a cliché: ‘Trend is your friend apart from the bend at the end’
I dont like the new low method descirbed in this post because you may give back too much of your gain in my mind.
Typical BS avoidance reply. This jerk can't trade for Zhit, all he does is hang around on these boards licking the CMC owners @rse hoping for a job. Ignore him, or ask to see his Profit and Loss statement, that'l scare him off back into his make believe trading cave.
Catch 22: I want to stay in the trend but at the same time don't want to give too much back.
Who said trading is easy?
You're in the wrong thread. This isn't the CMC Markets thread.
Peter
You're a funny guy? Like finds like, keep posting away and looking for indicators to help you trade, lol, and IF you ever make it, you will have realised that indicators did not help you get there, brains did. :smart:
You're a funny guy? Like finds like, keep posting away and looking for indicators to help you trade, lol, and IF you ever make it, you will have realised that indicators did not help you get there, brains did. :smart:


Thanks very much, what is the differnace between using a MACD or a Stock Osl?