What is depicted in the chart below is a partial list of the call options for the stock of Apple Computer when it was selling for $190.25 per share. All the options were for a certain expiration date a few weeks in the future.
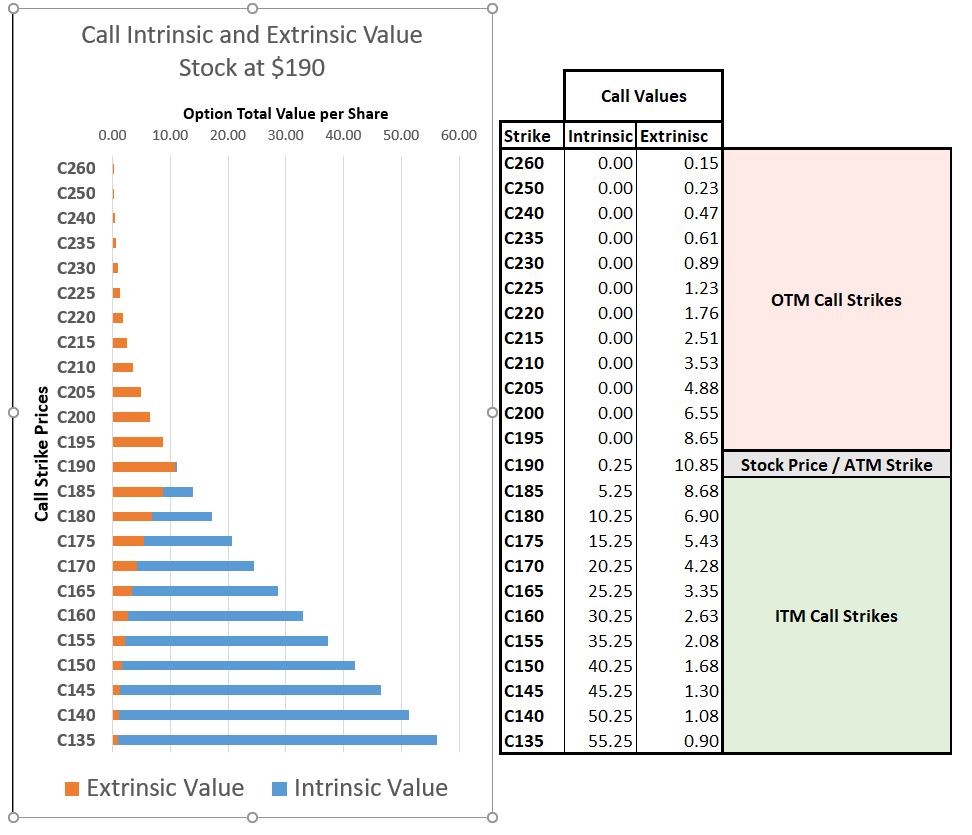
In the table above right, each row shows a call option at a particular strike price. For each call, the amount of Intrinsic Value and the amount of Extrinsic Value are shown. Calls at strike prices below $190 (shown as C190) give their owners the right to buy shares of AAPL at a discount to the $190.25 market value. These calls are said to be In the Money, and to have intrinsic value.
Row C160 for, example, shows the call at the $160 strike. $160 is a discount of $30.25 compared to the market price of $190.25; so, $30.25 is shown as that call’s Intrinsic Value. That $160 call was actually selling for a price of $32.88. This was in excess of the call’s intrinsic value ($30.25) by $2.63. That extra $2.63 is shown as the option’s Extrinsic Value, which is also known as time value. It is the amount that option buyers were willing to pay for the chance that AAPL would go even higher by the time the options expired.
Looking to the left of the table, note the bar in the chart labelled C160. The blue part of the bar is that option’s intrinsic value of $30.25. The gold part of the bar is that option’s extrinsic (time) value of $2.63. Together, the blue and gold segments of the bar add up to the option’s actual price of $32.88.
Each row of the table works the same way, with the bar to its left showing the amounts of intrinsic and extrinsic value of that call option.
Looking at the option prices in this way helps us to see a few things:
- The total value of each option is greater the farther in the money it is. This is shown by the total width of each bar being greater than the bar above it.
- Options at strike prices higher than the stock’s price of $190.25, which are referred to as being out of the money, have no intrinsic value at all (no blue segment).
- Those out of the money calls have smaller and smaller amounts of extrinsic value the farther out of the money they are.
- Strikes that are very far out of the money (C260 and up) have no value at all. This makes sense: an option to buy a $190 stock for $260 isn’t worth anything if there is no chance that the stock could reach $260 by the time the option expires.
- One thing we can infer from these charts is that as the stock price changes, the amounts of both intrinsic and extrinsic value change also. Imagine that Apple now instantaneously moves up from $190 to $200. The $160 call would now be in the money by $40 instead of $30. It would occupy the position that the $150 strike had occupied before, when it was $40 in the money. The $160 call would now be worth about $37.33 ($40.25 of Intrinsic Value and $2.08 of Extrinsic Value), like the $150 call had been before. The value of every other call on the list would rise as well, as each occupied a new slot.
- Strike prices that are farther in the money are more valuable the farther in the money they are (greater total bar width); but the amount of Extrinsic Value (gold segment) is actually smaller and smaller for strikes that are farther in the money. For strikes that are very far in the money (C135) there is a massive amount of Intrinsic Value (wide blue segment), but virtually no Extrinsic Value.
- Looking at the Extrinsic Value (gold segments) only, we see that the greatest amount of time value is contained in the $190 strike – the strike that is called the At the Money or ATM strike.
Point number 7 above deserves its own chart, shown below, showing only Extrinsic Value.
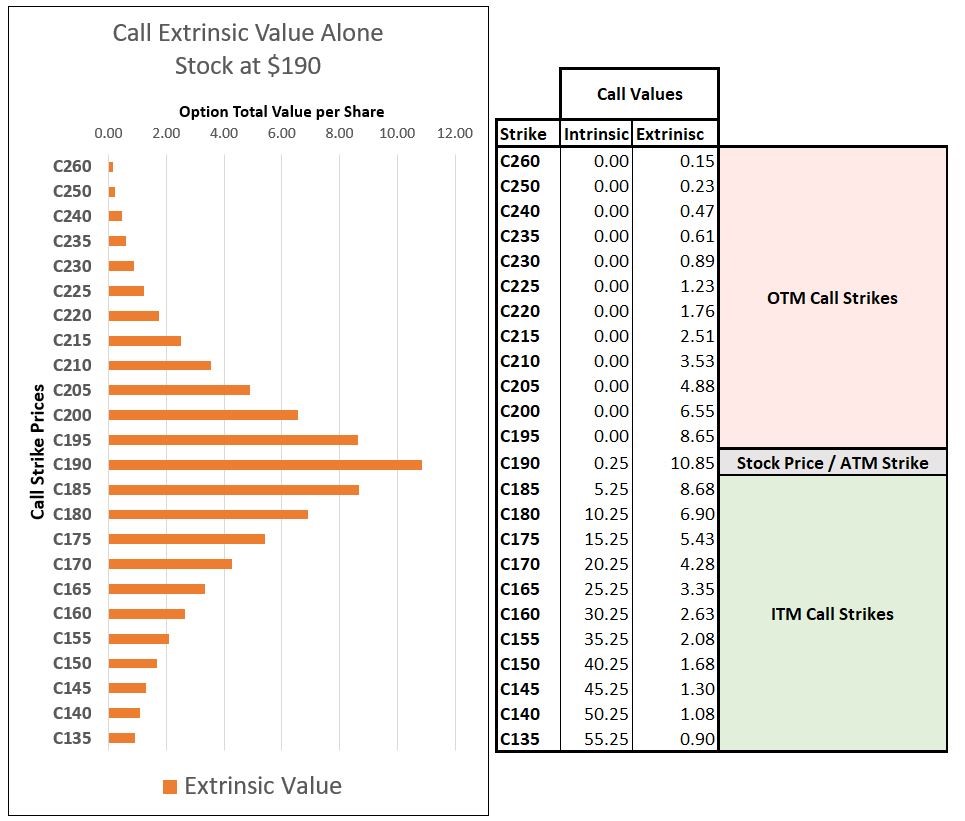
This second chart makes it very clear that the greatest amount of Extrinsic Value is contained in the option at the strike which is At the Money or ATM ($190). All other strikes, higher and lower, have successively less extrinsic value the farther they are from the ATM strike. This has profound consequences for option traders, who could make money by knowing how extrinsic value works.
As we can see here, the extrinsic value of a specific option changes instantaneously when the underlying price changes. Extrinsic value of an option grows larger as the stock price approaches that strike from either direction. It then grows smaller again as the stock price moves away from it in either direction. This is why extrinsic value is a better term than time value.
So why is it sometimes called time value?
For the very good reason that as time passes, it grows smaller for every option. When the option reaches its expiration date, all extrinsic/time value is gone. At that time, all out-of-the money options (which have no intrinsic value) are worthless, and all in-the-money options are worth exactly their intrinsic value. Since that is true, the ATM option clearly has the most to lose as time passes.
Russ Allen can be contacted on this link: Russ Allen