There is a saying in trading, "Look left to make the right decisions." We will do the same. To determine the major trend of our stock, we can start at the current price and look left until we find a major top or major bottom. If we come to a major bottom, then we are likely in an uptrend and should trade in that direction until the major bottom has been violated. Should a major top come first, then we would be looking for shorting opportunities until that top has been violated by higher prices.
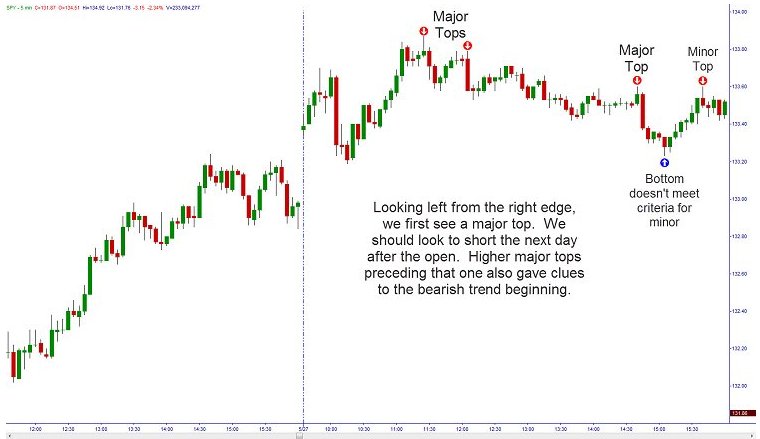
Figure 1
Once we have found the major trend, we can enter into that trend once an intermediate or minor trend is signaled. In the above chart, we saw that from the right edge of the chart, we first found a minor top. Since this doesn't give clues to the overall trend, we continue to look back in time until we reach a major top or bottom to set the trend. At approximately 14:30, there was a major top that signaled a bearish trend was dominating this time frame. We can also see that the trend is bearish from the preceding major tops earlier in the day forming a downtrend.
The next day opened with a gap up that broke the last major top. This would make a trader pause before taking trades. The second candle of the day closed below the low of the first thus forming a minor top and setting the stage for a gap fill and bearish trend.
The next day opened with a gap up that broke the last major top. This would make a trader pause before taking trades. The second candle of the day closed below the low of the first thus forming a minor top and setting the stage for a gap fill and bearish trend.
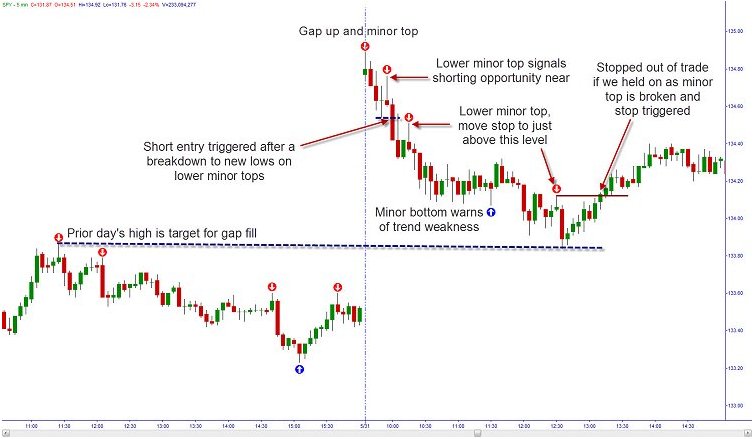
Figure 2
As previously said, the entry for the short is when we break to new lows after the lower minor top. Our stop is placed above the minor top and the target will be the prior day's high as this is an outside gap. When price makes lower minor tops, you can continue to move the stop tighter to protect profits on your way to the target. A major bottom warned of trouble for the downtrend, but since the subsequent move up did not break a minor top, we can stay in the trade. In fact, prices breaking lower than that major bottom showed that our target was within reach.
The price eventually did reach the target and a smart trader would have booked at least some profits. If you had decided to allow your profits to run, the trade would have been stopped out when the minor top was broken. Now that the last major happened to be a bottom, the trader could start looking for long opportunities. These opportunities would only come after a minor or intermediate bottom followed by a breakout to new highs. The stop would be the minor bottom itself.
The price eventually did reach the target and a smart trader would have booked at least some profits. If you had decided to allow your profits to run, the trade would have been stopped out when the minor top was broken. Now that the last major happened to be a bottom, the trader could start looking for long opportunities. These opportunities would only come after a minor or intermediate bottom followed by a breakout to new highs. The stop would be the minor bottom itself.
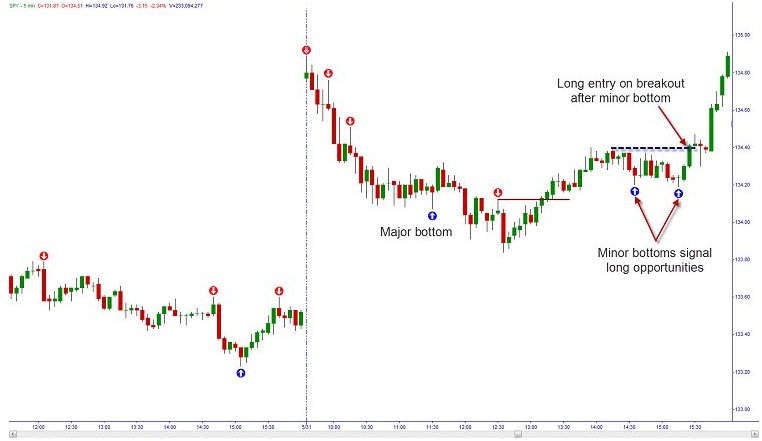
Figure 3
The big payoff for the trader comes when the markets enter into a trend. The very next day opened with a gap down that formed a major top. When prices broke the last minor bottom, they also broke lows and gave a signal to enter the trend short. By maintaining the stops above the most recent minor top, a trader was in on most of the collapse of the markets on that day.
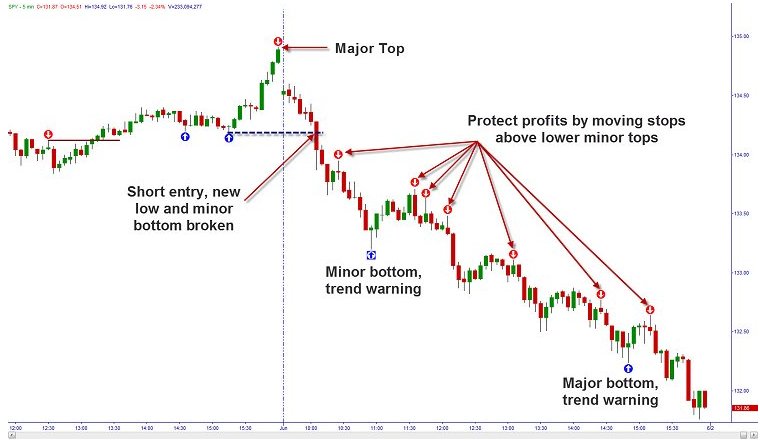
Figure 4
By following these rules, a trader was able to find the right trades to capture a larger part of the dominant trend. Note that they will not get the absolute high or low for entry, but trading with the trend allows you safer, higher probability, lower risk trades that build consistent profits we want. Next week, we will look to add more tools to the Gann Theory arsenal. Until then, trade safe and trade well.
Now that we have discussed the major, intermediate and minor tops and bottoms, we can now introduce a tool called the Gann Fan to identify potential support and resistance levels as we move in trend from those areas. This is not necessarily going to replace the supply and demand levels that you are already familiar with on your charts, but they can add to your precision when choosing entry and exit points for trades.
Gann believed that price moved in certain repeatable patterns based on price and time. In using the angles of the fan, you are looking at areas where prices are likely to turn due to a combination of the two. Since there are cycles that can be seen in all securities, a trend that is approaching the end of that cycle should turn at a predictable point. That point is the intersection of a fan.
TradeStation does have Gann Fans available on the program, but there is a catch. You will have to enter the "Points per Bar" that will set the angle of the fan and also the direction of the fan.
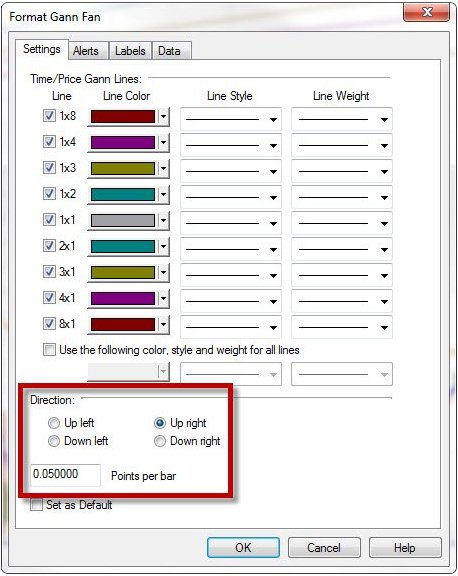
Figure 5
There is a guide as to the points per bar we should use for most securities. I have included a table here:
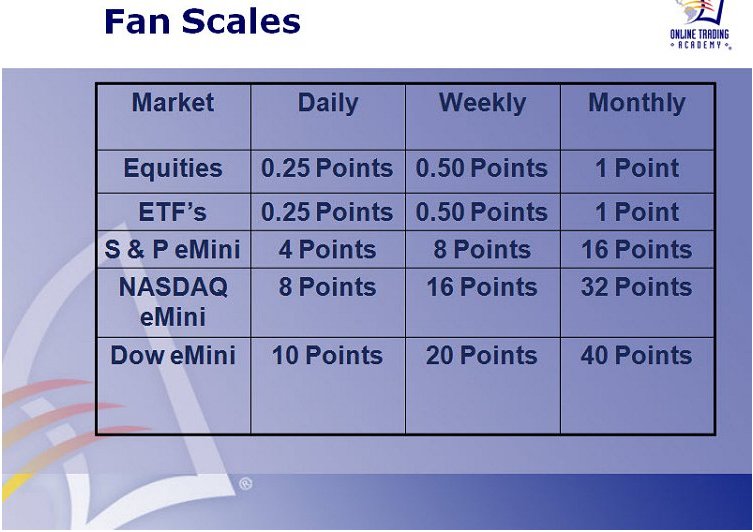
Figure 6
Let's see an example of how this works in a chart. We want to place these fans at the tops or bottoms that we are using as our starting point for the trend we are trading. That way, we can identify the supply and demand levels that are likely to reverse our security's price.
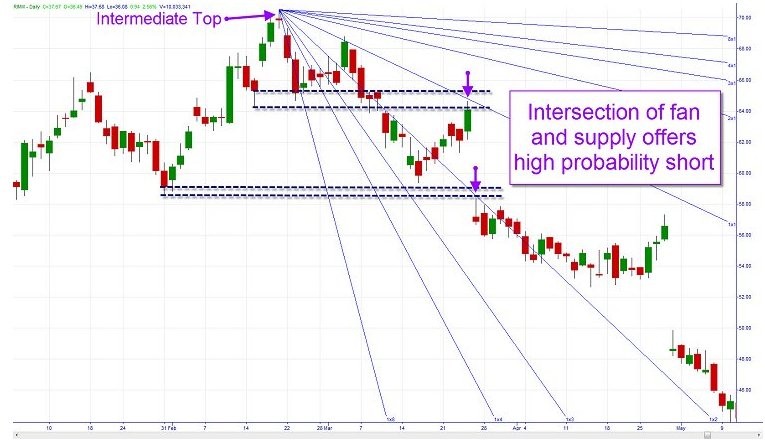
Figure 7
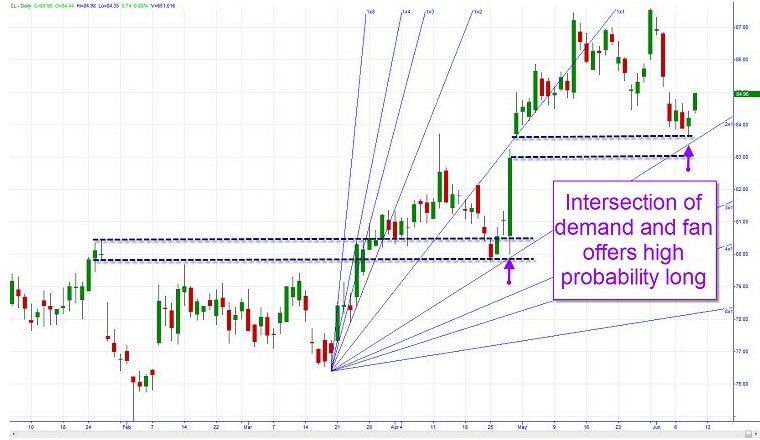
Figure 8
You may have noticed that both examples were on daily charts. Even the tables I showed only go as small as daily charts. So, what can we do if we are going to trade intraday? Well, we need to adjust the Points per Bar for intraday trading. You would simply do this by dividing the number of candles in a day into the daily table number. For example, there are 78, five minute candles per day. Dividing 78 into 0.25 tells us that we need to put 0.003205 into the Points per Bar for trading on a five minute candle chart. If we are using a fifteen minute chart, then we would divide 26 (there are 26, fifteen minute candles in a day) into 0.25 and use 0.009615.
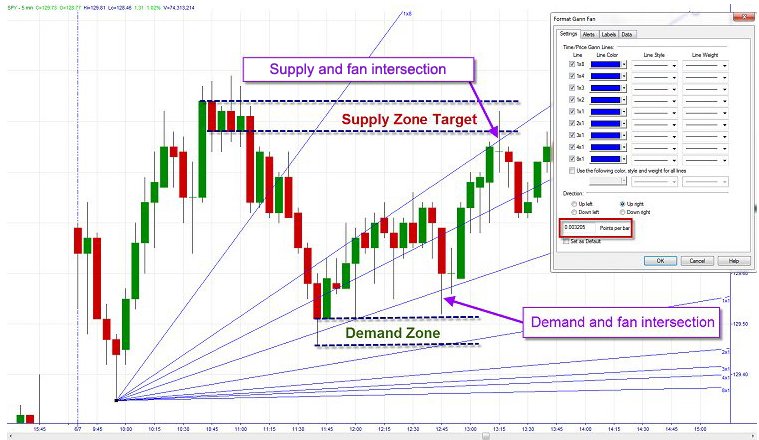
Figure 9
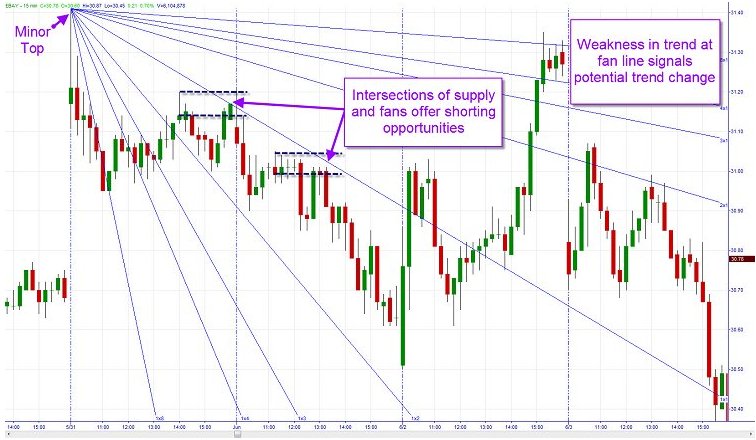
Figure 10
So, experiment with the fans and see if they can help you as an odds enhancer for your trading. Until next time, trade safe and trade well!
Last edited by a moderator: