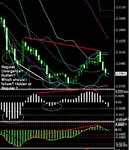
Please take a look at this chart that I have attached.
There were 2 divergences appearing:
1) Regular Bullish Divergence
Price: Lower Low
Osc: Higher Low
Indicating: BUY (Reversal of Trend)
Then another divergence occured
2) Hidden Bearish Divergence
Price: Lower High
Osc: Higher Higher
Indicating: Sell (Trend Continuation)
I understand that there should not be 2 divergence forming at once
Did I understand something wrongly?