TrendTracker
Member
- Messages
- 72
- Likes
- 0
Hello all,
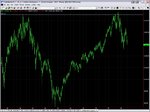
DJIA seems to be forming a huge head and shoulders market top. It seems that if we don't get a turn around from here (in the light of fundamentals there's not much hope) the H&S completes and the projection's at least to DJIA 10 000, and even below.
Take a look at the chart here: DJIA chart
What do you think? I'd appreciate both FA and TA view.
Cheers!
TT