Choosing what currency to invest in can be a daunting prospect. If you want to invest in a company you can check out its latest accounting statement to get the basic information you need: whether it is making or losing money, how much debt is held on the balance sheet etc. But there is no similar snap shot for individual currencies. A successful forex trader needs to keep up to date with economic data, geopolitical tensions as well as political landscape since all of these factors can move forex markets.
But, luckily for FX traders, there are some historical relationships that help make sense of the wider currency market. Firstly, the safe haven. Japan may have a debt-to GDP ratio of close to 200 per cent, yet the yen is considered a safe haven currency and tends to rally during periods of risk aversion. Whether or not it will continue to do so post the earthquake we will have to see, but it may take hefty amounts of G7 intervention in the FX markets to keep the yen down when investors next flee risky assets. The Swiss franc acts in a similar manner to the yen and also tends to appreciate during periods of market turmoil.
Secondly, Intermarket Technical Analysis. This looks at how markets move in relation to each other and was devised by John Murphy, a famous technical analyst from the US.
The guiding principle of Intermarket Analysis is that all markets (stocks, forex, commodities and bonds) are related and they don’t move in isolation. So, if you only look at the dollar without taking account of commodities for example, you could be missing vital clues about where the buck is headed next.
Using the dollar as an example we can do a very basic 101 in the fundamentals of Intermarket analysis. Since most commodities are priced in dollars, if the greenback starts to fall this has an upward effect on the price of oil, grains, cotton etc as you need more dollars to buy each commodity. But rising prices for oil or corn put upward pressure on inflation; since inflation is a rate of change, if the price of a commodity rises during the course of a month then it will be reflected in price indices.
Higher inflation is bad news for bonds as it means that central bankers will be more likely to hike interest rates. Bond prices and yields are inversely correlated, so when one rises the other falls.
Stocks are also sensitive to changes in interest rates, so a low dollar can eventually weigh on equity markets in two ways: 1, by boosting commodity prices and thus costs for companies, and 2, by increasing the cost of capital as interest rates rise to quash inflationary pressures.
The basic principle behind Intermarket analysis is that a weak dollar pushes up the price of commodities, which is inflationary and inflation is bad news for stocks and bonds. But how do investors trade this information? If you see the dollar start to trend lower over a period of months or days (look for trends, not intra-day ups and downs as this is only noise) then this should set off warning bells. The first-round effect of the weaker dollar will be higher commodity prices. Oil and industrial metals prices are at the top of the inflation pipeline, and thus start to rise before the cost of consumer goods. This causes bond prices to fall (yields to rise), which can then weigh on stocks. Commodities are key for traders since their price movements generate inflation, which impacts other markets.
So what does this tell us about how markets are performing right now? Oil prices have spiked in recent weeks caused by the crisis in oil-producer Libya and the threat of the protests spreading to other parts of the Middle East. It has also coincided with a decline in the dollar. Bond yields have been rising in line with the increase in commodity prices, but stocks remain in a technical up-trend. The resilience in equities is due to two factors, firstly, because rising commodity prices have a lagged effect on stock markets, and secondly, the developed world was on the brink of deflation not so long ago so inflation, as long as it is contained, is not such a bad development. Added to this, interest rates are extremely accommodative and the cost of capital is still low by historical standards, which could fuel equity market strength for some time yet.
Emerging market equities have behaved slightly differently and have been under pressure even though their developed market counterparts have remained well supported. This is due to the contrasting growth profile with the West. Economies in Asia and Latin America have bounced back strongly since the financial crisis and inflation from rising commodities is more of a threat to growth. Thus monetary conditions have been tightening for a while, which is weighing on stocks.
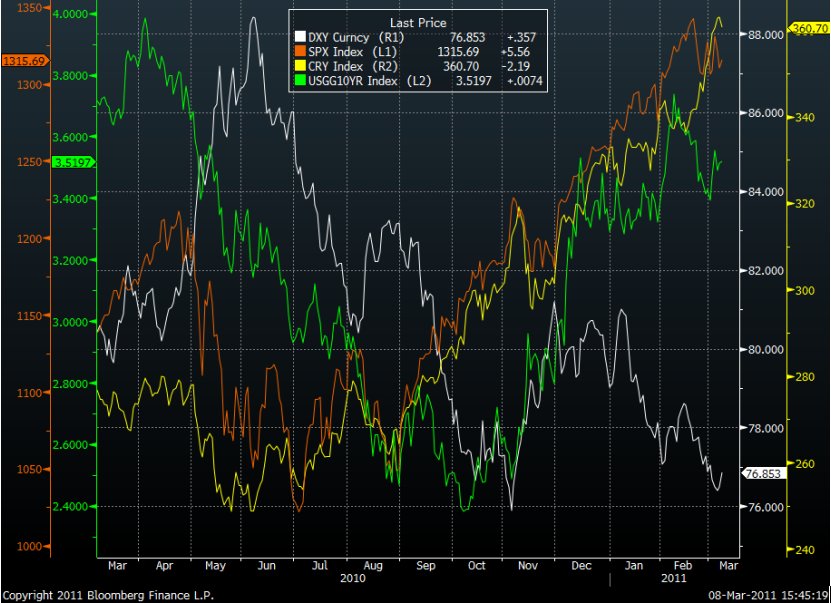
Intermarket analysis is one of many ways to analyse financial markets. For example, some people argue that higher oil prices can be good for stocks since they transfer wealth from oil importers to oil exporters who then invest this money in asset markets. But what investors like about Intermarket studies is that the relationships have tended to hold over long time periods and they can be seen on a chart – as you can see below - which shows a weak dollar, rising commodities and bond yields and the stock market just starting to falter.
S&P 500 – orange line
Thomson Reuters/ Jefferies CRY commodity index – yellow line
10-year US Treasury bond yields – green line
Dollar index – white line
This article is a basic introduction to Intermarket Analysis and is meant to piqué the interest to learn more about this analysis technique. It doesn’t do justice to the depth of study or intellectual rigour conducted by John Murphy. For example, it hasn’t even touched on the way certain commodities react to dollar weakness before others. That is for another time, for now though, good luck trading.
Kathleen Brooks can be contacted at Forex.com
But, luckily for FX traders, there are some historical relationships that help make sense of the wider currency market. Firstly, the safe haven. Japan may have a debt-to GDP ratio of close to 200 per cent, yet the yen is considered a safe haven currency and tends to rally during periods of risk aversion. Whether or not it will continue to do so post the earthquake we will have to see, but it may take hefty amounts of G7 intervention in the FX markets to keep the yen down when investors next flee risky assets. The Swiss franc acts in a similar manner to the yen and also tends to appreciate during periods of market turmoil.
Secondly, Intermarket Technical Analysis. This looks at how markets move in relation to each other and was devised by John Murphy, a famous technical analyst from the US.
The guiding principle of Intermarket Analysis is that all markets (stocks, forex, commodities and bonds) are related and they don’t move in isolation. So, if you only look at the dollar without taking account of commodities for example, you could be missing vital clues about where the buck is headed next.
Using the dollar as an example we can do a very basic 101 in the fundamentals of Intermarket analysis. Since most commodities are priced in dollars, if the greenback starts to fall this has an upward effect on the price of oil, grains, cotton etc as you need more dollars to buy each commodity. But rising prices for oil or corn put upward pressure on inflation; since inflation is a rate of change, if the price of a commodity rises during the course of a month then it will be reflected in price indices.
Higher inflation is bad news for bonds as it means that central bankers will be more likely to hike interest rates. Bond prices and yields are inversely correlated, so when one rises the other falls.
Stocks are also sensitive to changes in interest rates, so a low dollar can eventually weigh on equity markets in two ways: 1, by boosting commodity prices and thus costs for companies, and 2, by increasing the cost of capital as interest rates rise to quash inflationary pressures.
The basic principle behind Intermarket analysis is that a weak dollar pushes up the price of commodities, which is inflationary and inflation is bad news for stocks and bonds. But how do investors trade this information? If you see the dollar start to trend lower over a period of months or days (look for trends, not intra-day ups and downs as this is only noise) then this should set off warning bells. The first-round effect of the weaker dollar will be higher commodity prices. Oil and industrial metals prices are at the top of the inflation pipeline, and thus start to rise before the cost of consumer goods. This causes bond prices to fall (yields to rise), which can then weigh on stocks. Commodities are key for traders since their price movements generate inflation, which impacts other markets.
So what does this tell us about how markets are performing right now? Oil prices have spiked in recent weeks caused by the crisis in oil-producer Libya and the threat of the protests spreading to other parts of the Middle East. It has also coincided with a decline in the dollar. Bond yields have been rising in line with the increase in commodity prices, but stocks remain in a technical up-trend. The resilience in equities is due to two factors, firstly, because rising commodity prices have a lagged effect on stock markets, and secondly, the developed world was on the brink of deflation not so long ago so inflation, as long as it is contained, is not such a bad development. Added to this, interest rates are extremely accommodative and the cost of capital is still low by historical standards, which could fuel equity market strength for some time yet.
Emerging market equities have behaved slightly differently and have been under pressure even though their developed market counterparts have remained well supported. This is due to the contrasting growth profile with the West. Economies in Asia and Latin America have bounced back strongly since the financial crisis and inflation from rising commodities is more of a threat to growth. Thus monetary conditions have been tightening for a while, which is weighing on stocks.
Intermarket analysis is one of many ways to analyse financial markets. For example, some people argue that higher oil prices can be good for stocks since they transfer wealth from oil importers to oil exporters who then invest this money in asset markets. But what investors like about Intermarket studies is that the relationships have tended to hold over long time periods and they can be seen on a chart – as you can see below - which shows a weak dollar, rising commodities and bond yields and the stock market just starting to falter.
S&P 500 – orange line
Thomson Reuters/ Jefferies CRY commodity index – yellow line
10-year US Treasury bond yields – green line
Dollar index – white line
This article is a basic introduction to Intermarket Analysis and is meant to piqué the interest to learn more about this analysis technique. It doesn’t do justice to the depth of study or intellectual rigour conducted by John Murphy. For example, it hasn’t even touched on the way certain commodities react to dollar weakness before others. That is for another time, for now though, good luck trading.
Kathleen Brooks can be contacted at Forex.com
Last edited by a moderator: