Advice for cleaning up data

Vrothdar

Well-known member
Messages
344
Likes
30
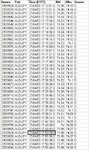
I'm in the process of downloading forex tick data from GAIN Capital Rate Data Archive with a view to cleaning it up and using it to test out mechanical trading systems.

Now, before I can do that, I need a little help. Firstly I'm after some confirmation of what each of the columns are. (See attached) The timezone I can check by comparing to another data source but if anybody can confirm that it's EST that would help. Any guidance on the other two columns would be greatly appreciated as I haven't a clue!

Secondly, for a confidence boost as much as anything else, I could do with a little advice with regards to cleaning the data up. From what I've been able to find out I need to determine and correct the following:

  1. Overlapping (repeated) data
  2. Erroneous tick sizes (causing a massive, say 500 tick, spike lasting one tick)
  3. Gaps in the data

1) Overlapping data - Should I be looking for data points with the same timestamp down to the second? If so then this shouldn't be too much trouble either.

2) Erroneous tick sizes should be dead easy. Flag up any tick that is greater than a single pip different from either the tick before or after then delete them.

3) My first thoughts for tracking down gaps in the data would be to look at the data points flagged up when looking for erroneous tick sizes - if there is more than a single pip of movement there is at least one missing tick that should be between the two.

I've also been thinking about how I deal with time changes for DST. Would I expect to see 2 hours in a row that are, apparently, the same time and then when the time is moved in the other direction expect to see a "missing" hour? Would the timestamps actually be adjusted for DST at all? How is the open/close handled when DST comes into effect?

Thanks in advance for any advice.
 

Attachments

  • GainCapital Rate Data.JPG
    GainCapital Rate Data.JPG
    133.6 KB · Views: 1,015
Thanks for the pointers Gamma. You're right I don't fully understand the nature of my data. I suppose it's fortunate for me that I'm not going to be trading in the mirco short term. I'll be using it to create my own bars, probably 15mins at smallest, more likely 1hr and 1day bars.

Thanks for deliberately not spoon feeding me the answers - I'd rather try to work these things out myself but sometimes a little direction from somebody more experienced is of great benefit. I'm sure the experience of working this out (mostly) for myself will serve me well when I start looking at other data sources.
 
Why? This makes no sense. Why should the market not move more than a single tick at a time? (p.s. this is a rhetorical question - I know the answer, I'm just trying to see if you can follow the route to it yourself without it being spoonfed to you).

My immediate thought is that because the data only shows the times of actual transactions (committing the mother of all sins and assuming this for the time being) the difference between one data point and the next could be of unlimited size.

If the last transaction was at 1.5002/1.5004 but nobody else is willing to sell at that price but 100 more people want to buy then the price would continue to rise until the offers reached a level where either the buyers would pay no more or a seller enters the market.

This would either cause a period where the pair was illiquid or a gap of more than a single tick between the latest transaction and the last would form.

:edit: I realise it was rhetorical and I'm sure that what I've said is correct (if I can back up my assumption) but for some reason I'm lacking confidence (unusual, I'm normally a bit of a cocky little proverbial) in myself on this so thought I'd throw my thoughts out there.
 
Last edited:
  1. Overlapping (repeated) data
  2. Erroneous tick sizes (causing a massive, say 500 tick, spike lasting one tick)
  3. Gaps in the data

Ive also downloaded the gain capital ratedata and placed it into a sqlite database. I can confirm it needs cleaning!

By putting it into a database, overlapping/repeated/out-of-order data doesnt pose an issue to me. When i retreive the data (say to convert into OHLC bars on different timeframes, or into metatrader hst files, or any other conceivable use), ordering by time should fix those issues. Repeats arent an issue because I use the timestamp as a unique key. The only issue I have with repeats is if the repeated timestamp has different quotes, but since there isnt a way to resolve that I dont worry about which my database stores.

After importing the data into the database, I then run some simple data cleaning operations that should help with erroneous ticks. I delete any negative ticks, or ticks that have a larger difference than some threshold from both the preceeding and following ticks. This will remove individual 500pip jumps, but if a couple are consecutive, they are left in the database...

Gaps I also dont worry about. After all, I cant synthesize whats not there. I do find where I have gaps, I just dont fill the gaps in. Short-term gaps I just take as "simulating" brief internet outages (and the corresponding missing data), since in practice that is something my strategies will have to deal with. Longer gaps are an issue, and I generate a txt file with a graphical display of tick "coverage" for each pair to help me determine where these gaps are. This file simply has a single line for each week, with an ascii symbol representing each hour. I use a different symbol to represent if only the first/last half hour contains ticks. This helped me find some strange ticks occuring when the market should be closed (on the weekend) at the beginning of 2005. Im not sure how that got there (if its due to my parser its interesting it never occurs in any other part), but to save myself the hassle of dealing with that, I just use data from march 05. There are still a few hour+ gaps in this data, but not as many as pre-05... Maybe I SHOULD insert fractally-generated data into these gaps? or blend in data from some other tick source...

note that you can get largely pre-cleaned data from Thinking Stuff, though I havent tested this and its probably not been updated for a while.

I dont really have a solution for the daylight savings issue. I thought of taking the second occurance of times as the latter dst-shifted value, but had an issue with the wrong weeks data occuring in downloaded files, which would have yielded larger price-errors than simply ignoring the DST-adjustment.

I beleive gain DO occasionally update the data archive, so some of these errors may be fixed.

All this is done from python scripts, doing this kind of cleaning by hand would be very very insane. My tick database is around 20Gig, and the uncompressed datafiles are significantly larger, so make sure you have room!

If you come up with any other data cleaning suggestions id be interested to hear them.
 
Thanks for that post. I'm currently working with a different data source but will still be cleaning up the gain data at some point to check that I get the same results from my strategies using an alternative data set.

After importing the data into the database, I then run some simple data cleaning operations that should help with erroneous ticks. I delete any negative ticks, or ticks that have a larger difference than some threshold from both the preceeding and following ticks. This will remove individual 500pip jumps, but if a couple are consecutive, they are left in the database...

Perhaps you could get rid of a few more by generating a list of ticks with a large difference between the preceding or following ticks, rather than both, and check those manually assuming the list is small enough.
 
Perhaps you could get rid of a few more by generating a list of ticks with a large difference between the preceding or following ticks, rather than both, and check those manually assuming the list is small enough.

True, but it would require checking them manually then... Dont want to automatically remove valid volatility after market openings following holidays etc... I think I get most of the odd ticks this way, without taking too much work... If I cant automate the cleaning, im happy to let a few weird ticks through. After all, a live data feed from a broker could always have errors too...

What data feed are you using now?
 
After all, a live data feed from a broker could always have errors too...

That's very true. I'm currently working with data from disk trading (website is currently down) which is supplied in various time frames and in tick format.
 
Top