futurestrick
Newbie
- Messages
- 1
- Likes
- 0
Hello, everyone, we are FuturesTrick, this is our latest development of commodity futures analysis tool that combines data science and international trade data. It can quickly find out the country's market of the potential futures price changes. The data sources are from UN, ITC, WTO, and other large third-party units. Combining factors such as trade volume, distance, GDP, tariffs, and other factors for analysis and social network intelligent algorithm processing; using international trade data to analyze commodity futures, this is a new type of analysis method, welcome to use for free.
website URL: [Link Removed]
 By the way, our logo concept is designed with the "Eye of Providence", because our development idea is "Let you see the world from the perspective of God".
Take, in January 2021, the retail account calling the action on the Reddit forum in the United States caused the price of silver to rise as an example.
Global Trade Map

According to the "Global Trade Map" in the figure left, we can find that the countries with close trade relations in the US silver industry are Canada and Mexico. Therefore, changes in the US silver price are likely to also affect the silver of these two countries. Compare news materials, Canadian silver miner First Majestic Silver jumped 21.38% to close at $16.86 on January 28, 2021, a record high since August 16, 2016, the intraday peak soared 39%. In addition, users can also observe the changes in the close degree of trade of various commodities in different countries’ markets by selecting different time periods.
Trade Data

Here is an overview of the trade data of the import and export countries in the past year, such as the total trade volume of the United States, the share of total imports and exports, total volumes of imports and exports, total annual growth, total average distance, and total average tariffs... and so on. Provide various trade indicators that may impact and assist users in observing the country's market due to changes in commodity futures prices.
Trade Detail Data

Users can further confirm the details of the import and export trade data of the selected country to each country. For example, the trade volume of the United States to each country, the proportion of imports and exports, the import and export exceeding, the annual growth, the average distance, and the average tariff... etc., and also observe the latest changes in the volume of import and export trade in the eight quarters. Provide various trade indicators that may have an impact, and assist users in observing the country's market that may be affected by changes in commodity futures prices.
Futures Quotes

Users can view the latest international futures quotations at any time. Data sources are Investing, Barchart, and Eastmoney, etc., three financial websites. Provides quotation information of major futures markets, including the United States, the United Kingdom, Europe, India, and China, to help users quickly observe the changes in quotations in different country markets.
News

Users can view the latest news related to commodity transactions. The sources of the information are Investing and Barchart, etc., two financial websites. To help users quickly grasp the overview of the recent increase in commodity futures.
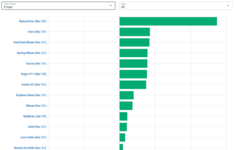
Hot News Tag Counts-Bar Chart

Count the number of occurrences of various commodity futures news in the past five days. Help users quickly grasp the volume and hotspots of various commodity futures news.
Hot News Tag Counts-Line Chart

Daily update the record of the changing trend of the number of times of various commodity futures news in the past five days. Help users to observe changes in the volume and hotspots of various commodity futures news.
Futures Market Map

Users can observe the price changes of various commodity futures on the day and present them in a visual way. The darker green means more rises, and the darker red means more falls. Furthermore, the left side of the page shows the overall futures status today. To help users quickly grasp the overview of the recent increase in commodity futures.
Performance Leader

Users can observe the changes of various futures on the same day, five days, one month, six months, and year to date. The green represents the rise and the red represents the fall. It is convenient for users to grasp the general situation of the increase of various commodity futures in different time intervals.
website URL: [Link Removed]
Take, in January 2021, the retail account calling the action on the Reddit forum in the United States caused the price of silver to rise as an example.
Global Trade Map
According to the "Global Trade Map" in the figure left, we can find that the countries with close trade relations in the US silver industry are Canada and Mexico. Therefore, changes in the US silver price are likely to also affect the silver of these two countries. Compare news materials, Canadian silver miner First Majestic Silver jumped 21.38% to close at $16.86 on January 28, 2021, a record high since August 16, 2016, the intraday peak soared 39%. In addition, users can also observe the changes in the close degree of trade of various commodities in different countries’ markets by selecting different time periods.
- The colors of the circles represent market groups in different countries.
- The size of the circle represents the volume of import or export trade.
- Users can click on the circle to view the country's import and export trade detail data.
Trade Data
Here is an overview of the trade data of the import and export countries in the past year, such as the total trade volume of the United States, the share of total imports and exports, total volumes of imports and exports, total annual growth, total average distance, and total average tariffs... and so on. Provide various trade indicators that may impact and assist users in observing the country's market due to changes in commodity futures prices.
Trade Detail Data
Users can further confirm the details of the import and export trade data of the selected country to each country. For example, the trade volume of the United States to each country, the proportion of imports and exports, the import and export exceeding, the annual growth, the average distance, and the average tariff... etc., and also observe the latest changes in the volume of import and export trade in the eight quarters. Provide various trade indicators that may have an impact, and assist users in observing the country's market that may be affected by changes in commodity futures prices.
Futures Quotes
Users can view the latest international futures quotations at any time. Data sources are Investing, Barchart, and Eastmoney, etc., three financial websites. Provides quotation information of major futures markets, including the United States, the United Kingdom, Europe, India, and China, to help users quickly observe the changes in quotations in different country markets.
News
Users can view the latest news related to commodity transactions. The sources of the information are Investing and Barchart, etc., two financial websites. To help users quickly grasp the overview of the recent increase in commodity futures.
Hot News Tag Counts-Bar Chart
Count the number of occurrences of various commodity futures news in the past five days. Help users quickly grasp the volume and hotspots of various commodity futures news.
Hot News Tag Counts-Line Chart
Daily update the record of the changing trend of the number of times of various commodity futures news in the past five days. Help users to observe changes in the volume and hotspots of various commodity futures news.
Futures Market Map
Users can observe the price changes of various commodity futures on the day and present them in a visual way. The darker green means more rises, and the darker red means more falls. Furthermore, the left side of the page shows the overall futures status today. To help users quickly grasp the overview of the recent increase in commodity futures.
Performance Leader
Users can observe the changes of various futures on the same day, five days, one month, six months, and year to date. The green represents the rise and the red represents the fall. It is convenient for users to grasp the general situation of the increase of various commodity futures in different time intervals.