Cable opinions...

Tickdoc

Active member
Messages
108
Likes
1
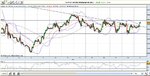
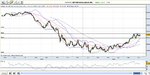
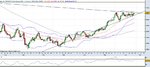
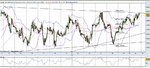
Cable is in an interesting range recently between 16200 and 16500. Today's quad witching has seen it higher mid-range and holding for now. While this could be seen as a bullish consolidation near the higher edge of the range, I am also seeing a shallow but visible set of lower highs within the range since the highs on the 11th. Support at 16210 has kept the lows consistent but a break of that could see a drop to fib levels of 16115 (38.2%) or down to 16000 (23.6%), after that, down to the recent low of 15810. The daily shows a curved bottom containing a possible double bottom, relatively bullish consolidation recently and potential for a climb into 17000-17500 territory.

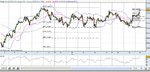
It will be interesting to see if the lower highs continue after this extraordinary Friday or if it will continue to break that shallow triangle formation and go for the higher edge of the range. Anyone have any thoughts?
 

Attachments

  • cable1.jpg
    cable1.jpg
    111 KB · Views: 248
  • cabledaily.jpg
    cabledaily.jpg
    100.1 KB · Views: 244
Witching is the only way in which it's out of the ordinary. London trading thus far has been dullsville in G7. You may get some moves now NY are in, but they'll be pretty low volume affairs and as such may lack conviction to follow through next week (unless they're provoked by some newsworthy event).
 
Sure, by extraordinary, I meant NOT ordinary due to the witching...I am in fact interested in what will happen in the next week and beyond...
 
Hitting the top of the range now and dropping back slightly. A break of the range would significant especially if it breaks the recent highs. Then again we might sink back into the range, next few days could be key...
 

Attachments

  • cable2.jpg
    cable2.jpg
    107.5 KB · Views: 273
OK then, well I'm looking for a retracement to 16480 before a resumption of the upwards pressure.
Was looking for further opinion...
 
Made a bit on the retracement, cancelled the long order, made a nice kitty...Now we are back in the range, I'm going to be a watcher for a while, see which extremes we test next.
 
Clear H&S on the hourly now, went short at 16300, hoping for a big move down....
 
Long term having been long GBP/USD waiting for the trend to continue, but lots of ranging trading during the week on the one hour chart. Clearest range I've seen in a while.
 
Long term having been long GBP/USD waiting for the trend to continue, but lots of ranging trading during the week on the one hour chart. Clearest range I've seen in a while.

I can never remember seeing a day like this on the fx markets. I follow 8 pairs but, only trade a max of 4 (including cable). There was so much chop across the board (no pun intended), it was almost impossible to make money.
 
ya I know what you mean alan; I only dared a single trade today for 40 pips at 7$ per pip; other pair that I followed all looked choppy or barely moved the whole day.
 
Craziness! Should have stuck to my failure signal of the head and shoulders though @ 16320 long. Would have made a nice profit. Hard to act on something like that in such conditions though! A lot of indecision at the latest peak though, a drop back into the range to 16450, 16370, 16250?
 

Attachments

  • cable3.jpg
    cable3.jpg
    109 KB · Views: 190
Still waiting for a breakout on the daily...hourly showing the ranging sticking mostly to the pattern. Consolidation at the top of the range could mean an upside move, will wait for an hourly close above that level for long confirmation.
 

Attachments

  • cable4.jpg
    cable4.jpg
    91.1 KB · Views: 170
  • cable5.jpg
    cable5.jpg
    114.6 KB · Views: 218
We're so close to the top on this range. I'm waiting for it to close above 1.66 on a 4 hour chart.

Still waiting for a breakout on the daily...hourly showing the ranging sticking mostly to the pattern. Consolidation at the top of the range could mean an upside move, will wait for an hourly close above that level for long confirmation.
 
We're so close to the top on this range. I'm waiting for it to close above 1.66 on a 4 hour chart.

It's looking very much like a break above 1.66 is the next move. I'm not looking at this on a 4 hr chart though. If it breaks this level, on the 5 min chart, I will take a Long trade once it's made a swing low after the break out.
 
I left a Buy Stop order with my SB company, overnight, to be filled @ 1.6618 with a Sell Stop order @ 1.6568. This got filled and, by the time I got to my trading desk at 7 am, it was around 1.6680. I closed the position, manually, at 08.30. Got filled at 1.6692. I did go short later in the day,approx
10.15, after the 3 little sisters move and picked up another 128 pts. Finished before 4 pm. Very nice day.
 
4 hour charts? You must be fu**ing joking. The really big money is made by the day traders. Don't listen to anyone who says different. They've switched to 4 hr charts because they don't know how to make money from the 5 & 15 min charts.
 
4 hr charts? My last platform didn't even offer them so I don't have much experience of them. Often use daily for a big picture and other than that 1 hr, 15 min...

Robots? You mean for cable trading?
 
Top