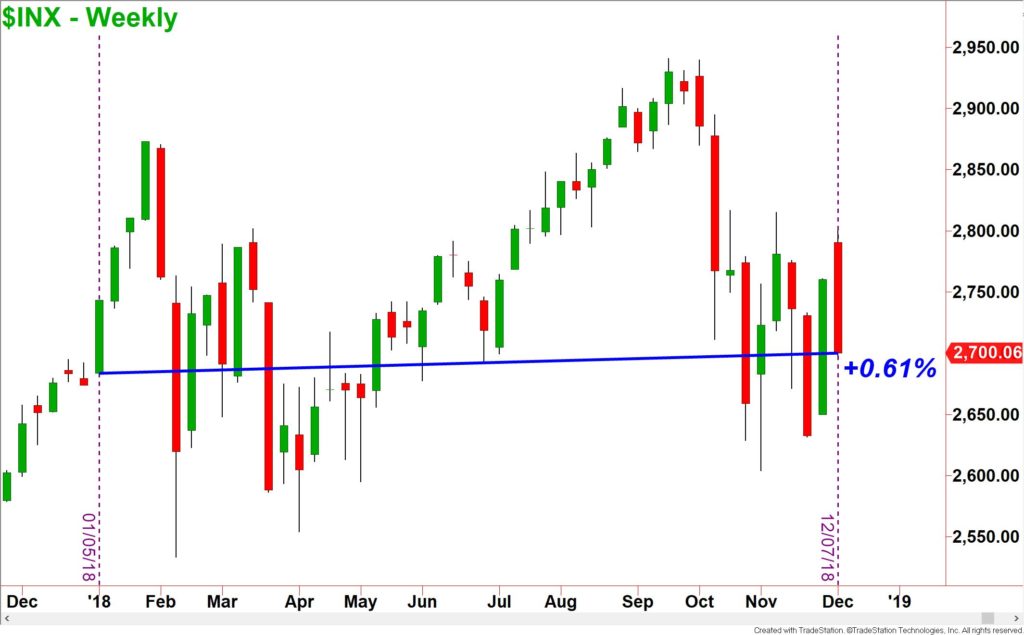
This has not been an easy year for investors. As of the date I am writing this article, the S&P 500 index is trading at nearly the same level as it started the year. Buy and hold investors are either flat or more likely negative for the year due to fees.
For those without the proper knowledge, this has been a lost year because many investments were flat, and you lost an entire year of your investing life. However, with the right knowledge and strategy, this was an excellent market to profit from smaller holding periods. Actively trading these choppy markets would have netted great profits with smaller risk.
Last month I wrote about the broad markets and whether they were hinting at a simple correction or reversal into a bear market. Looking at some of the fundamental evidence available, I am leaning more towards a recession in the US economy to accompany the upcoming crash. I know that this is a bold statement, but there are many things pointing this direction that cannot be ignored.
One of the most recent issues that is signalling the increased potential for a recession is the Yield Curve. The Yield Curve is a comparison of the interest rates of the US Treasury bonds. When a Treasury bond is purchased, the buyer is effectively loaning money to the US Government. The government will pay interest to the buyer of the bond. The longer the period that the money is loaned, the more risk the buyer is assuming. Therefore, the longer the money is loaned to the government, the more interest the buyer should receive. This would cause a normal yield curve as bonds with maturities of 3 months, one year and two years would have lower interest rates than bonds that mature in ten, 20 or 30 years.
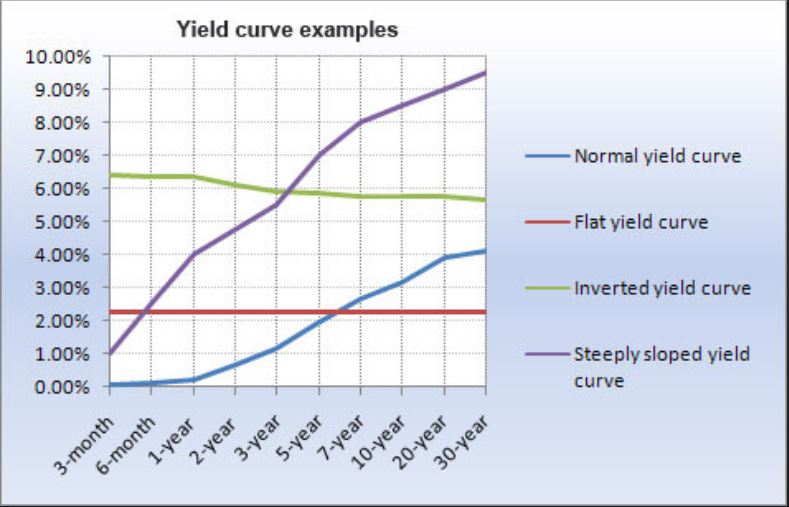
Recently, to control inflation, the Federal Reserve has been raising interest rates. This trickles down and effects the yields paid in the treasuries. When investors are nervous about the US economy, they are not as eager to lend money to the government by buying bonds. To entice the bond buyers, higher interest rates are offered on shorter term maturities. Investors will migrate to these shorter maturities when they fear that the stock market is about to crash, and a recession is imminent.
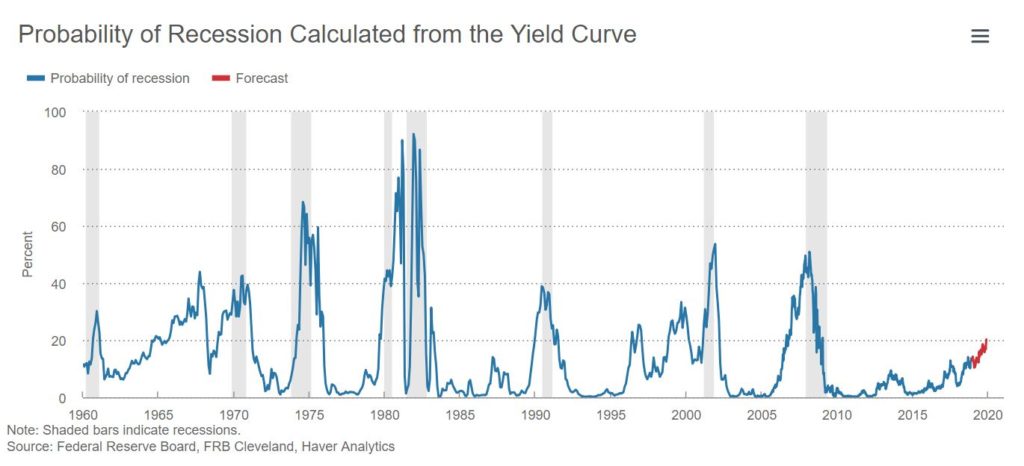
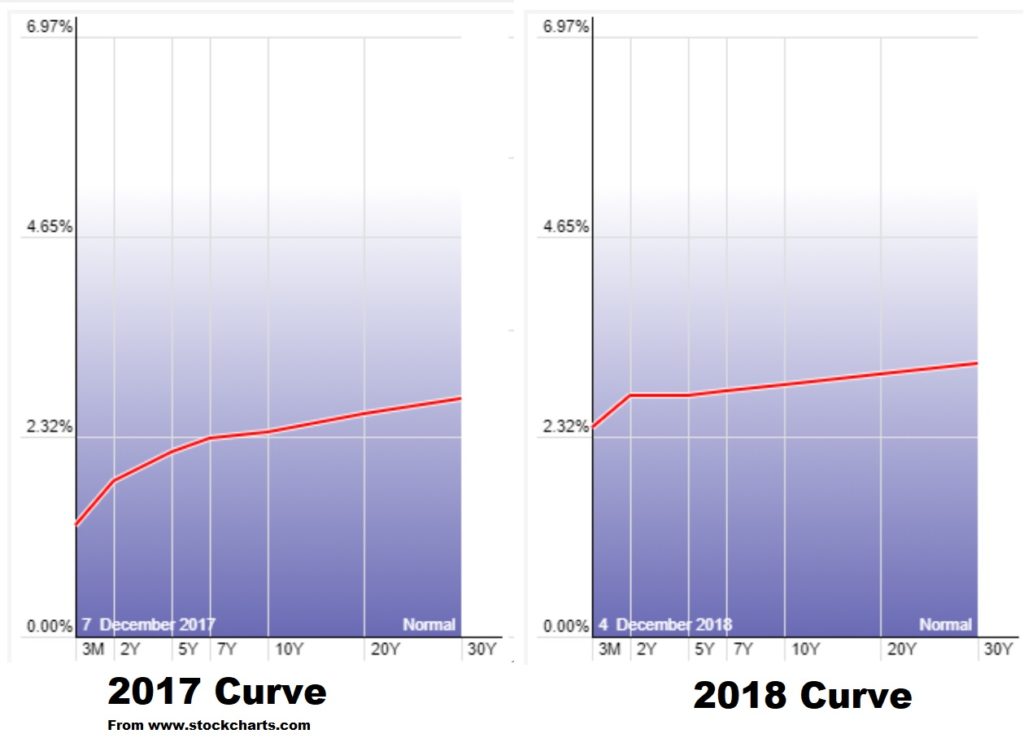
As you can see from the picture above, the short-term yields are going up faster than the long term. This has flattened the yield curve and could lead to an inversion of it. It is important to note that while every recession was proceeded by an inverted yield curve, not every inverted yield led to a recession. So, we need to look at the charts in order to determine the potential direction of the equity markets for the next year.
Last month, I wrote about a couple of indications that were warning of a weak market. Let’s review them and update the forecast for future price.
The S&P 500 index gave off two warnings on the monthly chart. The first was the negative divergence with the RSI momentum indicator. When prices are moving up to new highs, it should be doing it with increased bullish momentum. When the momentum drops while prices are rising, it is called negative divergence and price is likely to drop soon.
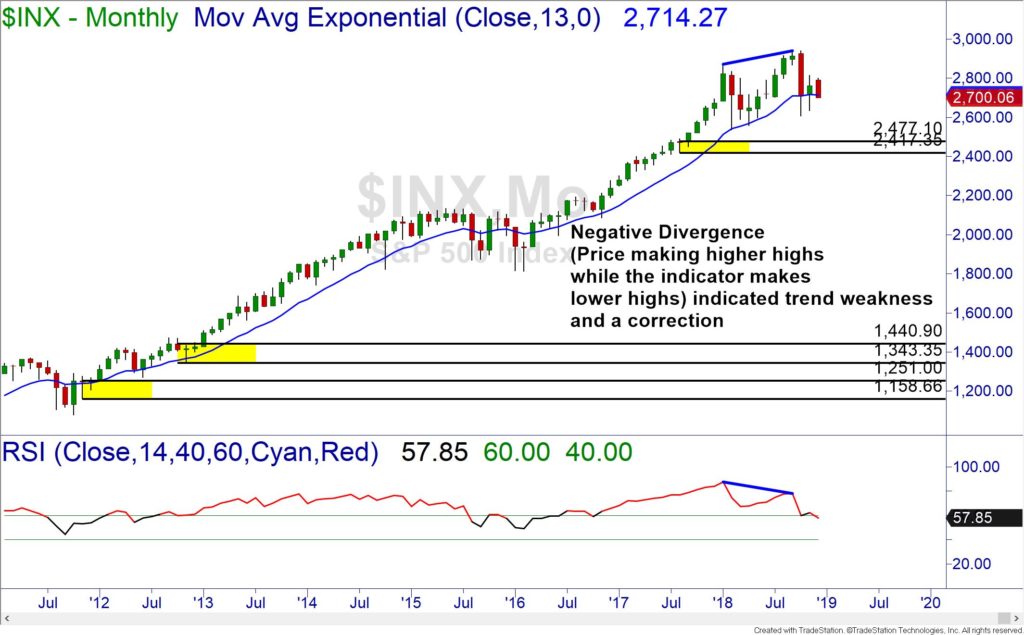
Additionally, the 13-period exponential moving average on the monthly chart is a sort of line in the sand. When the monthly price closes below the 13EMA there is usually a lower low made before any new highs can be made. This does not mean that prices will crash but it does open the door for the possibility.
Should the S&P 500 drop, then there is a monthly demand at 2477. This is likely to be a small bouncing point before the bear begins to growl. If the recession sets in, price on the S&P 500 could seek out the next monthly demand at 1440.
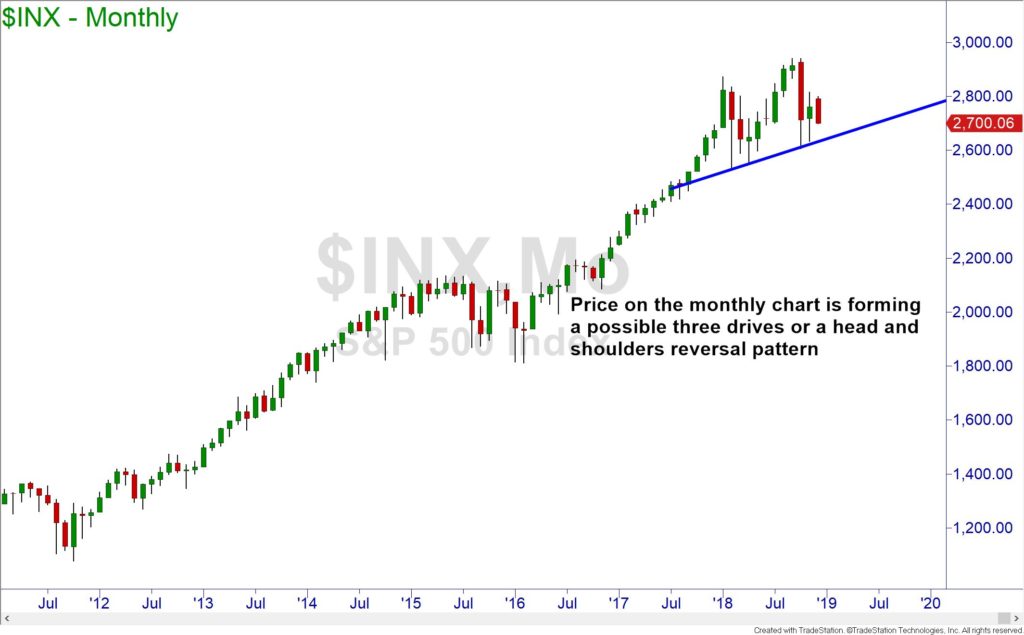
It is also interesting to note that the price is possibly forming either a head and shoulders or a three drives formation. Both formations hold bearish meanings for the market.
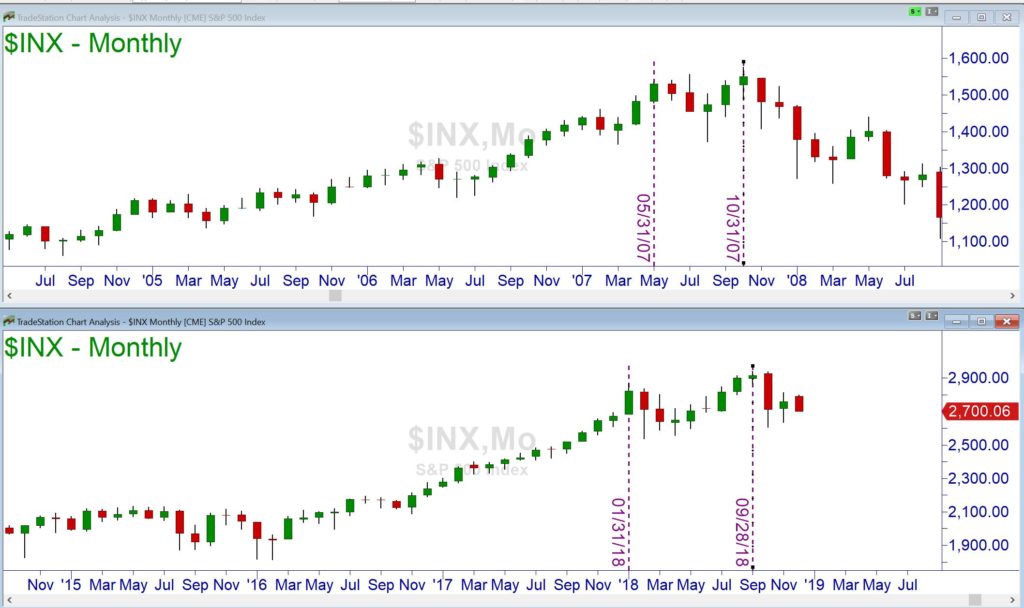
One last observation on the price action of the S&P 500. When you compare the monthly chart of the S&P 500 from the peak in 2007 to the current monthly chart, you can see that they are eerily similar!
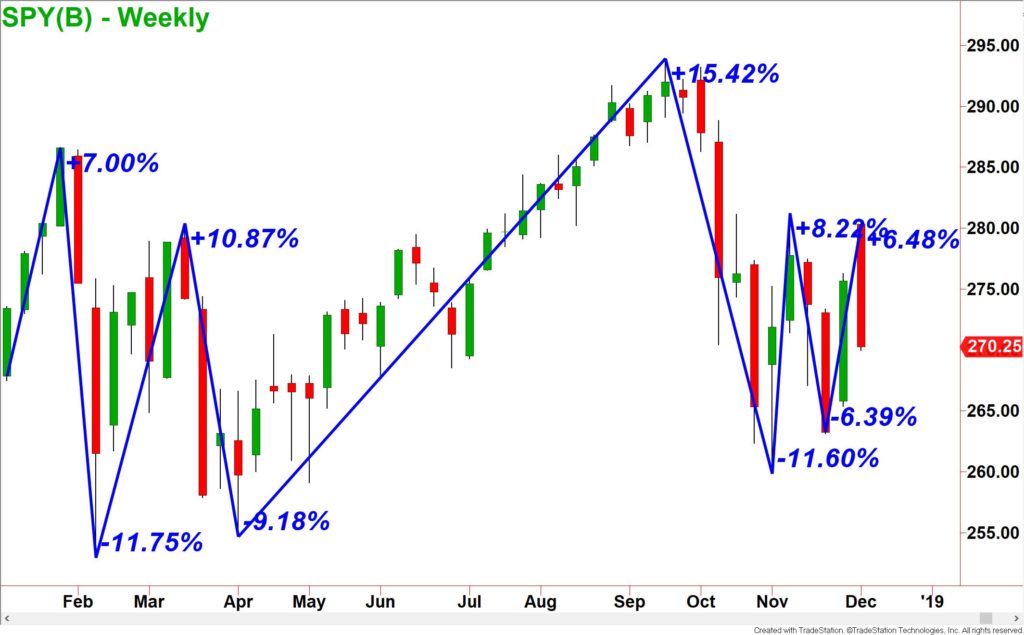
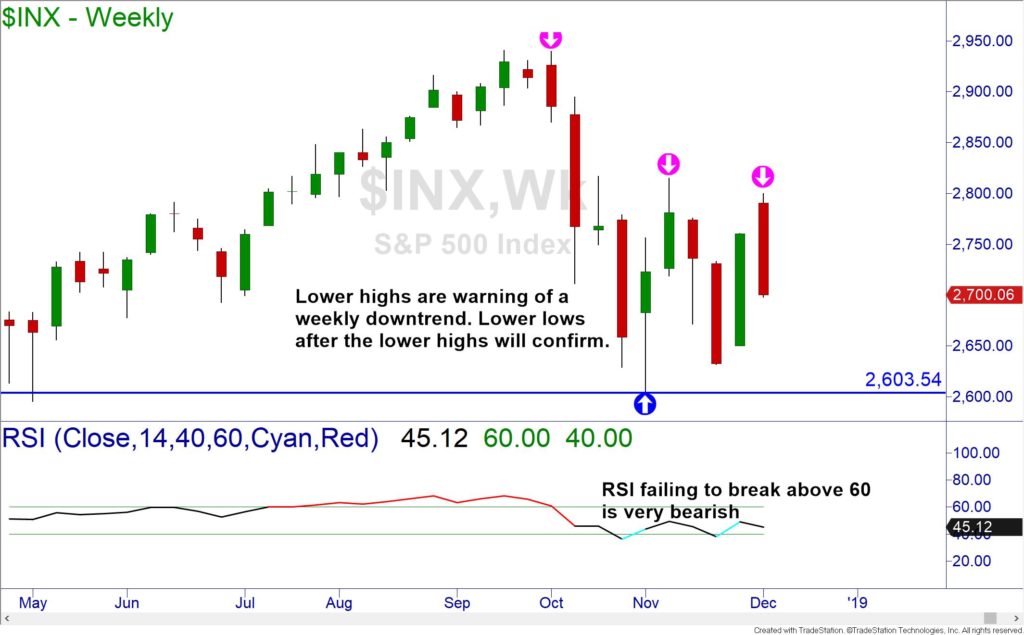
The bearishness is not firmly in place yet. Looking at the weekly chart of the S&P 500, we are seeing weakness as the momentum indicator cannot rise above 60. Once price makes lower lows after lower highs, the downtrend will be confirmed.
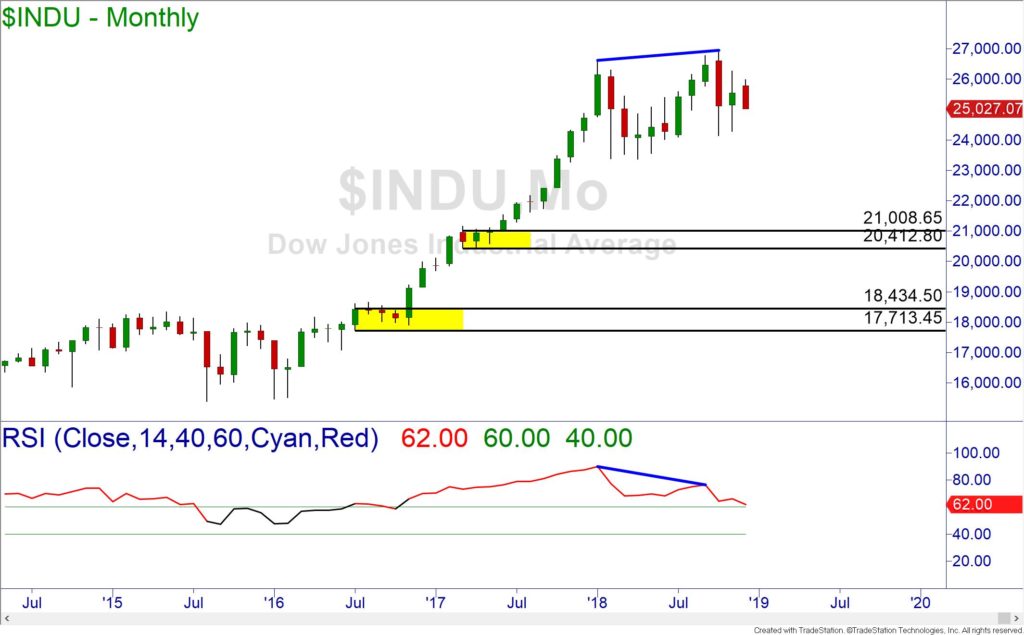
The Dow charts are showing the same picture as the S&P. The only difference would be the price levels.
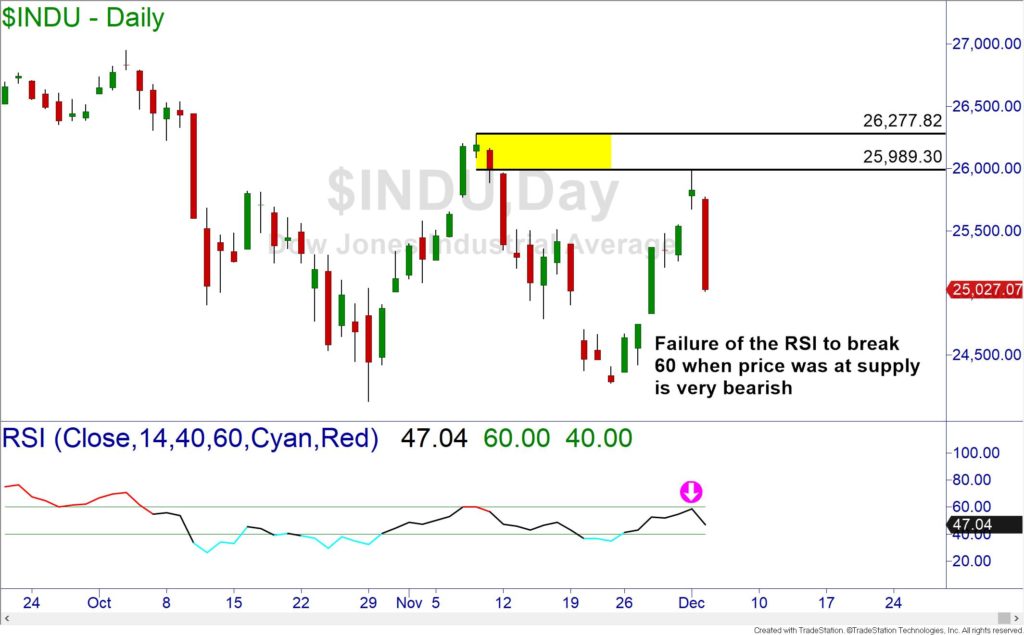
The Dow index is also signalling bearishness. On last week’s test of supply, the zone held and RSI did not go above 60. This is showing the sellers firmly in control of price. The final signal to look for before a collapse in price is if there is a lower low made after the lower highs. We have not seen that yet.
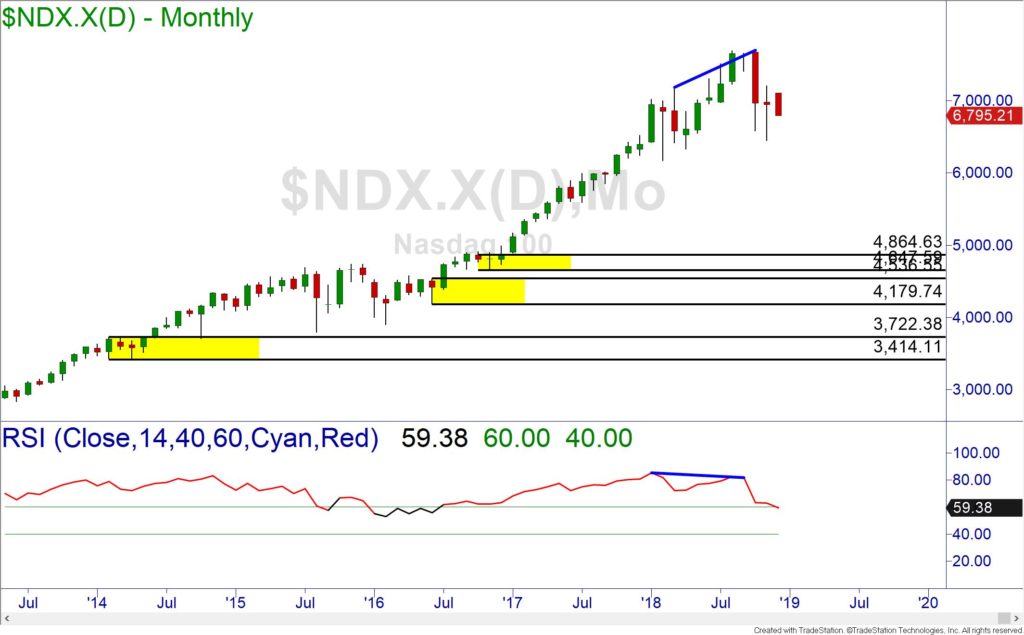
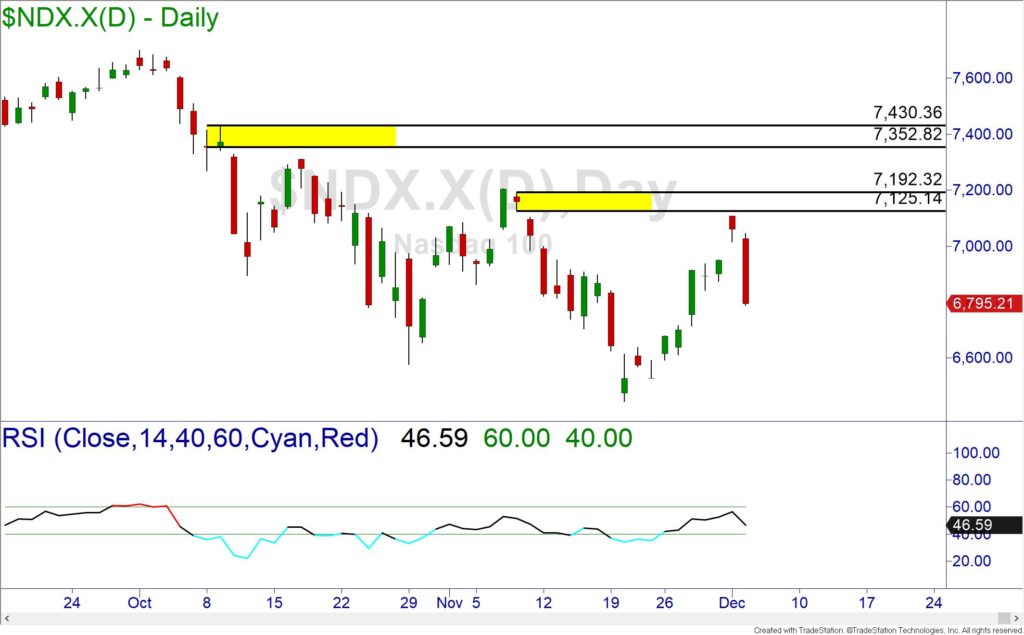
The Nasdaq 100 index is in a precarious position. The monthly chart of the index is demonstrating the same bearish divergence as the others, but the nearest demand is a lot further away.
The daily picture of the Nasdaq 100 is also a picture of sellers in control. The index is so weak that price keeps failing before it can even reach the supply zone.
So, there is still time left for a Santa Claus rally, but the charts are signalling for a very bearish 2019 and a recession before 2020. Looking at the evidence on the charts, it appears that the real collapse in price should take place in the second quarter of 2019.
To post comments on the discussion thread Click Here
Brandon Wendell can be contacted on this link: Brandon Wendell
Last edited by a moderator: