One of the charting differences between Equities and Futures is that some Futures trade for almost 24 hours per day. Once Equities stop trading at 16:00 EST, the last price that a trader sees on their chart is usually the closing price. The next morning when the market opens at 9:30 EST and the price is higher or lower than the previous closing price, then the trader effectively has a gap opening.
Before electronic and 24 hour trading came to the Futures markets, we were able to do the same thing and be within one or two price ticks of the actual closing price. Now, we have different trading sessions to contend with. In a recent article, I wrote about these two different sessions:
Now, we have markets that open and trade for a while before suspending trade and then resume trading into the close of the day. This is where it is important to understand the final price of every trading day for each Futures contract. The exchanges refer to this final price as a settlement price. Since all Futures contracts are marked to the market at the close of every trading day, it is very important for the Futures Commissions Merchants (FCM) to have a settlement price. An FCM is where all of our trading funds are kept once we have opened a Futures account. At the end of each trading day, the FCM will debit/credit all accounts that had transactions or still have open positions from the day.
Once an Exchange creates this settlement price, the FCM has an absolute value to use. If there was no settlement price, then at the end of every trading day, you can imagine how many different closing prices there would be for the same product depending on when your software stopped collecting data.
The settlement price is calculated differently for different Futures markets. I am going to show you how some of the more popular ones are settled, and then show you why it is important to understand this process. These rules are from the Chicago Mercantile Exchange for both electronic and pit traded products.
From reading these rules for calculating the settlement prices, you can see that, normally, these prices are taken upon the RTH closing prices. Then the ETH session starts and can trade for 2-3 more hours that same day; this is what causes price distortions on your charts. When trading the E-mini S&P and E-mini Nasdaq markets, you will not have to worry about these settlement prices distorting your charts. The reason is the market closing time (4:15 pm EST) is the same as the settlement price time.
Let's look at a market that does have these possible distortions. The reason we want to be aware of these distortions is because what appears to be a gap on a chart may not be in reality because of these settlement prices. This could prove dangerous to gap traders.
Figure 1 will be a daily (all session) chart of the Ten Year Treasury (TY) market. This market has RTH and All Sessions.
When you want to know what the settlement price (official close) of each trading day was, always consult a daily chart. Do not use an intra-day chart because they do not calculate settlement prices. The last price we see on the right axis (130'16.0) is the settlement price from November 16, 2011 for the TY.
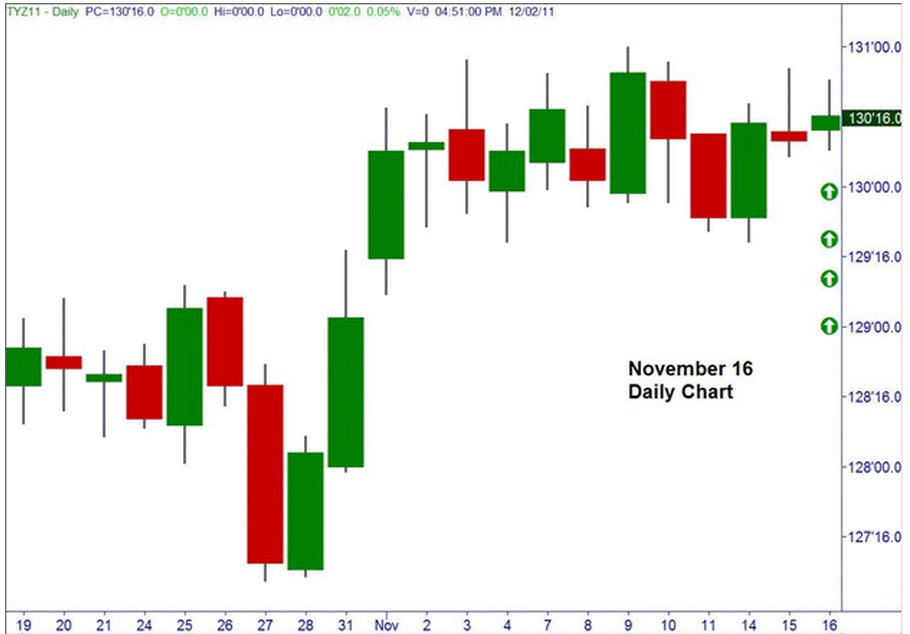
Figure 1
Now, let's look at Figure 2 and we will see an intra-day chart of the TY for the same date as Figure 1.
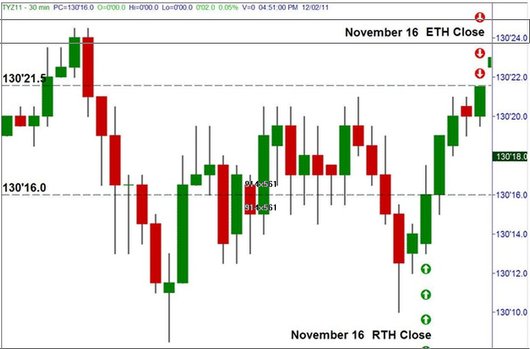
Figure 2
Figure 2 will demonstrate how a market that trades 2 hours beyond the RTH session as the TY does, can show two different closing prices for the same day. We can see that the RTH session closed at 130'16.0. Even though this is the RTH closing price, we cannot assume this is the official settlement price. Refer to the rules for the sector you are trading for how the settlement price is calculated, and then get the official price off of a daily (all session) chart. Notice how the market trades for another 2 hours and the 17:00 EST close is actually at 130'21.5; this is 11 TY ticks higher than the official settlement for that day.
Let's assume you were trading the TY the next day. When you open your charts, you will see the market trading at the open around 130'16.0, and when you compare this to the last price at 17:00 EST (130'21.5) the previous day, it appears the market has gapped down 11 TY ticks. But has it really gapped? No, because the official settlement was 130'16.0. Basically, the market is trading unchanged on the day when trading at this level.
If you were a gap trader without this knowledge of how Futures prices are settled each day, then you would be fading a gap that never existed. We all know how trades that we make up turn out.
Some other markets that this issue happens in are:
Clearing up any confusion about charting the Futures markets is important so you know how to read the price action. I have found that most people get confused when the Sunday night open occurs and they are still looking at the last price from Friday's trade instead of the settle price. This can cause real problems trading a weekend gap.
Before electronic and 24 hour trading came to the Futures markets, we were able to do the same thing and be within one or two price ticks of the actual closing price. Now, we have different trading sessions to contend with. In a recent article, I wrote about these two different sessions:
- Regular Trading Hours (RTH) – This session is always the most liquid time of the entire session. Usually, a trading pit is open during this time, but not necessarily in the case of the Inter-Continental Exchange products.
- Extended Trading Hours (ETH) – This session starts after the RTH session ends and runs right up until the next RTH opening price. For most markets, this is an overnight session and the volume is much less than the RTH session.
Now, we have markets that open and trade for a while before suspending trade and then resume trading into the close of the day. This is where it is important to understand the final price of every trading day for each Futures contract. The exchanges refer to this final price as a settlement price. Since all Futures contracts are marked to the market at the close of every trading day, it is very important for the Futures Commissions Merchants (FCM) to have a settlement price. An FCM is where all of our trading funds are kept once we have opened a Futures account. At the end of each trading day, the FCM will debit/credit all accounts that had transactions or still have open positions from the day.
Once an Exchange creates this settlement price, the FCM has an absolute value to use. If there was no settlement price, then at the end of every trading day, you can imagine how many different closing prices there would be for the same product depending on when your software stopped collecting data.
The settlement price is calculated differently for different Futures markets. I am going to show you how some of the more popular ones are settled, and then show you why it is important to understand this process. These rules are from the Chicago Mercantile Exchange for both electronic and pit traded products.
- Equity Futures: For S&P and NASDAQ, the settlement price of the lead month contract is the midpoint of the closing range determined based on pit trading activity between 15:14:30-15:15:00 Central Time ("CT"). For all other equity indices, the Volume Weighted Average Price (VWAP) of trades executed on Globex between 15:14:30-15:15:00 CT is used to determine the settlement prices for the lead month contracts. Back month contract months are settled to traded or quoted spread relationships. E-mini S&P and Nasdaq are settled to the value derived from the Big S&P and Nasdaq.
- Treasury Futures: Globex trades in the lead month between 13:59:30-14:00:00 CT are used to derive the VWAP; back months are settled based on traded/quoted spread relationships.
- Forex Futures: For the Australian Dollar, Canadian Dollar, Euro, Pound, Swiss, Yen, Peso, and Kiwi, Globex trades in the lead month between 13:59:30-14:00:00 CT are used to derive the VWAP; back months are settled based on traded/quoted spread relationships.
- Energy Futures: The front month in NYMEX WTI Crude Oil, Natural Gas, Heating Oil, and RBOB futures is settled at the VWAP of trades occurring on Globex between 14:28:00-14:30:00 EST.
- Agricultural Futures: Livestock products are settled to the midpoint of the trades, or the last valid price in the pit (including trades, higher bids, lower offers, or nominal close based on prior settle if no activity) between 12:59:30-13:00:00 CT. Dairy products are settled to the VWAP of the trades, or the last valid price on Globex between 13:09:30-13:10:00 CT. The lead contract month in Corn, Soybean, Meal, Oil, and Oat futures is settled at the price at which the Pit Committee, in consultation with Exchange staff determines traded the preponderance of the volume in the closing range and the back contract months are settled to keep the spread relationships in line. The lead contract month in Wheat and Rice futures settle to the VWAP of trades on Globex between 13:14:00-13:15:00 CT and the next 4 contract months in Wheat, and all deferred months in Rice are settled based on Globex spread data. Wheat futures beyond the fifth month are settled by the Pit Committee in consultation with Exchange staff based upon spread relationships.
From reading these rules for calculating the settlement prices, you can see that, normally, these prices are taken upon the RTH closing prices. Then the ETH session starts and can trade for 2-3 more hours that same day; this is what causes price distortions on your charts. When trading the E-mini S&P and E-mini Nasdaq markets, you will not have to worry about these settlement prices distorting your charts. The reason is the market closing time (4:15 pm EST) is the same as the settlement price time.
Let's look at a market that does have these possible distortions. The reason we want to be aware of these distortions is because what appears to be a gap on a chart may not be in reality because of these settlement prices. This could prove dangerous to gap traders.
Figure 1 will be a daily (all session) chart of the Ten Year Treasury (TY) market. This market has RTH and All Sessions.
- RTH Hours 8:20 – 15:00 EST (Mon/Fri) (Pit Session)
- All Session Hours 18:00 – 17:00 EST (Sun/Fri)
When you want to know what the settlement price (official close) of each trading day was, always consult a daily chart. Do not use an intra-day chart because they do not calculate settlement prices. The last price we see on the right axis (130'16.0) is the settlement price from November 16, 2011 for the TY.
Figure 1
Now, let's look at Figure 2 and we will see an intra-day chart of the TY for the same date as Figure 1.
Figure 2
Figure 2 will demonstrate how a market that trades 2 hours beyond the RTH session as the TY does, can show two different closing prices for the same day. We can see that the RTH session closed at 130'16.0. Even though this is the RTH closing price, we cannot assume this is the official settlement price. Refer to the rules for the sector you are trading for how the settlement price is calculated, and then get the official price off of a daily (all session) chart. Notice how the market trades for another 2 hours and the 17:00 EST close is actually at 130'21.5; this is 11 TY ticks higher than the official settlement for that day.
Let's assume you were trading the TY the next day. When you open your charts, you will see the market trading at the open around 130'16.0, and when you compare this to the last price at 17:00 EST (130'21.5) the previous day, it appears the market has gapped down 11 TY ticks. But has it really gapped? No, because the official settlement was 130'16.0. Basically, the market is trading unchanged on the day when trading at this level.
If you were a gap trader without this knowledge of how Futures prices are settled each day, then you would be fading a gap that never existed. We all know how trades that we make up turn out.
Some other markets that this issue happens in are:
- Currencies
- Agricultural
- Metals
- Sugar, Cocoa, Cotton, Orange Juice
- Dow and Russell Stock Indexes
Clearing up any confusion about charting the Futures markets is important so you know how to read the price action. I have found that most people get confused when the Sunday night open occurs and they are still looking at the last price from Friday's trade instead of the settle price. This can cause real problems trading a weekend gap.
Last edited by a moderator: