First of all, congratulations to everyone who made money on the recent Japanese Yen rally. One of my students caught some nice chunks of the recent move lower in USD/JPY, earning 70 pips and 85 pips on successive trades. Way to go, M!
The recent strength in the Japanese Yen created some terrific moves, but we should keep things in perspective - the gains made during the recent move lower in NZD/JPY (New Zealand Dollar/Japanese Yen), GBP/JPY (Great Britain Pound/Japanese Yen), and EUR/JPY (Euro/Japanese Yen) and other Yen pairs are nothing compared to the huge profits earned by long-term traders who were short the Japanese Yen when these pairs were rallying. For a case in point, have a look at the daily chart of NZD/JPY (see figure 1).
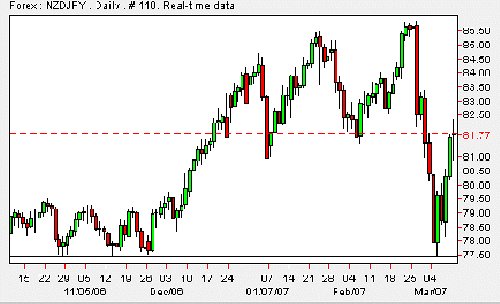
caption: Figure 1: NZD/JPY falls hard, then bounces off of support at 77.50 Source: Saxo Bank
As we can see in Figure 1, NZD/JPY formed a base of support at 77.50 in November and December, then rocketed higher. The recent pullback brought the pair all the way back to support at 77.50. Please note that this pair bounced higher by over 400 pips (meaning that the Yen is falling) in the past four sessions since reaching that support level.
You have to ask yourself, what is the dominant trend in NZD/JPY? To make this clear, take a look at the weekly chart (see Figure 2). Here we can see that not only is the dominant trend higher, but the recent activity has created a massive hammer formation in the most recently closed candle. In fact, the recent sell off did not even constitute a 38.2% retracement of the long-term uptrend, and the pair was hitting a multi-year high just prior to the sell off.
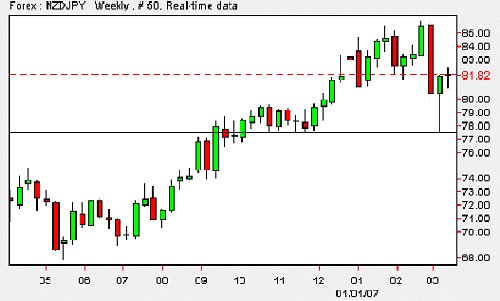
caption: Figure 2: NZD/JPY pullback viewed within the longer-term context of the weekly chart. Source: Saxo Bank.
The action in NZD/JPY is also reflected in other currency pairs - in fact, the trend is even more obvious in the weekly chart of EUR/JPY. Note once again the formation of a massive hammer pattern. This pair has also bounced over 400 pips in recent days
(See Figure 3).
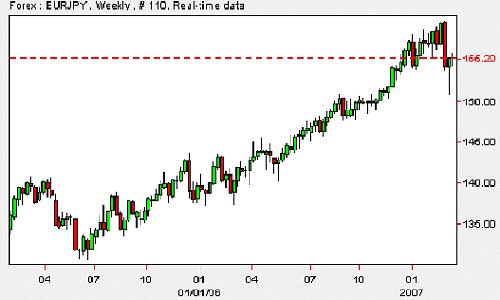
caption: Figure 3: EUR/JPY weekly; note the hammer formation. Source: Saxo Bank.
What Really Happened?
What led to this massive sell off? Has the Japanese Yen technical picture come unhinged from Japan's economic fundamentals? It's true that Japan's fourth quarter GDP growth came in at 4.8 percent, and then on March 12 was revised higher to 5.5 percent, well above market expectations. This represents the fastest pace of economic growth in Japan in the last three years. Does this mean that the Bank of Japan will continue to raise interest rates above the anemic current rate of 0.5 percent?
Not necessarily. Japanese inflation as measured by the core consumer price index fell to zero in January, the first flat reading in eight months. When stripped of volatile energy prices, the CPI fell 0.2 percent, the 13th straight month of decline. It's important to understand that this reading was taken before the Bank of Japan's most recent interest rate hike, which will likely have the effect of further depressing inflation when its full impact has worked its way through Japan's economy. Wage increases have stalled, blocking the normal mechanism through which corporate profits usually lead to inflation. Further rate hikes could plunge Japan into a deflationary spiral, similar to the one the country recently escaped after a number of years.
Why would Japan want to avoid deflation? In a deflationary environment, prices are constantly falling. While we all love a bargain, the long-term effects of deflation can be disastrous for an economy. Why splurge on a big-ticket purchase like a new home now, consumers figure, when it will likely cost less next year? During a deflationary spiral, customers delay purchases of homes, autos, and other items because they fear the price and value of these items will fall. As consumers slow their purchases, factories grind to a halt and economic growth is derailed. Japan's economy can ill afford this scenario, the memories of which are still freshly imprinted on the minds of that country's economists and consumers.
On the morning of Tuesday, March 13, 2007, the OECD (Organization for Economic Co-Operation and Development) weighed in on this issue. That morning, the following headlines crept across one of my news tickers:
10:00 GMT OECD: BOJ Shouldn't Attempt To Tackle Carry Trades
10:00 GMT OECD: Japanese Yen Exchange Rate Is "Very Weak"
10:00 GMT OECD: Deflation Lingering, Growth Unbalanced In Japan
10:00 GMT OECD: BOJ Shouldn't Hike Until Inflation "Firmly Positive"
10:29 GMT OECD's Cotis: Low Interest Rates Only Option For Japan
Source: Dow Jones Newswire
What is the bottom line? When we look at these charts, what we see is a vicious sell off from multi-year highs. This is not terribly surprising after a huge rally, which is exactly what we have seen in the JPY pairs over the past year. Large institutions have been building and adding to short JPY positions for months, as evidenced by the charts. Wherever huge profits exist, there is the possibility of huge profit taking. Is the Carry Trade dead? As Mark Twain once famously said, "Rumors of my demise have been greatly exaggerated." Perhaps this statement could be applied to the Carry Trade as well.
The recent strength in the Japanese Yen created some terrific moves, but we should keep things in perspective - the gains made during the recent move lower in NZD/JPY (New Zealand Dollar/Japanese Yen), GBP/JPY (Great Britain Pound/Japanese Yen), and EUR/JPY (Euro/Japanese Yen) and other Yen pairs are nothing compared to the huge profits earned by long-term traders who were short the Japanese Yen when these pairs were rallying. For a case in point, have a look at the daily chart of NZD/JPY (see figure 1).
caption: Figure 1: NZD/JPY falls hard, then bounces off of support at 77.50 Source: Saxo Bank
As we can see in Figure 1, NZD/JPY formed a base of support at 77.50 in November and December, then rocketed higher. The recent pullback brought the pair all the way back to support at 77.50. Please note that this pair bounced higher by over 400 pips (meaning that the Yen is falling) in the past four sessions since reaching that support level.
You have to ask yourself, what is the dominant trend in NZD/JPY? To make this clear, take a look at the weekly chart (see Figure 2). Here we can see that not only is the dominant trend higher, but the recent activity has created a massive hammer formation in the most recently closed candle. In fact, the recent sell off did not even constitute a 38.2% retracement of the long-term uptrend, and the pair was hitting a multi-year high just prior to the sell off.
caption: Figure 2: NZD/JPY pullback viewed within the longer-term context of the weekly chart. Source: Saxo Bank.
The action in NZD/JPY is also reflected in other currency pairs - in fact, the trend is even more obvious in the weekly chart of EUR/JPY. Note once again the formation of a massive hammer pattern. This pair has also bounced over 400 pips in recent days
(See Figure 3).
caption: Figure 3: EUR/JPY weekly; note the hammer formation. Source: Saxo Bank.
What Really Happened?
What led to this massive sell off? Has the Japanese Yen technical picture come unhinged from Japan's economic fundamentals? It's true that Japan's fourth quarter GDP growth came in at 4.8 percent, and then on March 12 was revised higher to 5.5 percent, well above market expectations. This represents the fastest pace of economic growth in Japan in the last three years. Does this mean that the Bank of Japan will continue to raise interest rates above the anemic current rate of 0.5 percent?
Not necessarily. Japanese inflation as measured by the core consumer price index fell to zero in January, the first flat reading in eight months. When stripped of volatile energy prices, the CPI fell 0.2 percent, the 13th straight month of decline. It's important to understand that this reading was taken before the Bank of Japan's most recent interest rate hike, which will likely have the effect of further depressing inflation when its full impact has worked its way through Japan's economy. Wage increases have stalled, blocking the normal mechanism through which corporate profits usually lead to inflation. Further rate hikes could plunge Japan into a deflationary spiral, similar to the one the country recently escaped after a number of years.
Why would Japan want to avoid deflation? In a deflationary environment, prices are constantly falling. While we all love a bargain, the long-term effects of deflation can be disastrous for an economy. Why splurge on a big-ticket purchase like a new home now, consumers figure, when it will likely cost less next year? During a deflationary spiral, customers delay purchases of homes, autos, and other items because they fear the price and value of these items will fall. As consumers slow their purchases, factories grind to a halt and economic growth is derailed. Japan's economy can ill afford this scenario, the memories of which are still freshly imprinted on the minds of that country's economists and consumers.
On the morning of Tuesday, March 13, 2007, the OECD (Organization for Economic Co-Operation and Development) weighed in on this issue. That morning, the following headlines crept across one of my news tickers:
10:00 GMT OECD: BOJ Shouldn't Attempt To Tackle Carry Trades
10:00 GMT OECD: Japanese Yen Exchange Rate Is "Very Weak"
10:00 GMT OECD: Deflation Lingering, Growth Unbalanced In Japan
10:00 GMT OECD: BOJ Shouldn't Hike Until Inflation "Firmly Positive"
10:29 GMT OECD's Cotis: Low Interest Rates Only Option For Japan
Source: Dow Jones Newswire
What is the bottom line? When we look at these charts, what we see is a vicious sell off from multi-year highs. This is not terribly surprising after a huge rally, which is exactly what we have seen in the JPY pairs over the past year. Large institutions have been building and adding to short JPY positions for months, as evidenced by the charts. Wherever huge profits exist, there is the possibility of huge profit taking. Is the Carry Trade dead? As Mark Twain once famously said, "Rumors of my demise have been greatly exaggerated." Perhaps this statement could be applied to the Carry Trade as well.
Last edited by a moderator: