There has been discussion recently about determining early in the day trend days vs consolidation. Does anybody have a veiw on the role volume has to play in this. I have been experimenting recently with an indicator which compares the cumulative volume so far today with the average cumulative volume at this time of day over the past few days.
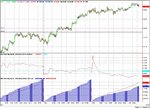
See picture below two versions of an indicator which tracks todays cumulative volume compared with recent history on SPY. The bottom chart tracks a histogram of todays vol vs a red line showing recent average. The middle chart shows todays vol/ the recent average. The bottom one is more intuitive but the middle one is easier to read once you understand what the number means.
On 4th October the big ramp up in volume when the market rallied between 10:00 and 10:30 led me to believe (correctly in hindsight) that we were having an uptrend day. Yesterday the high volume in first 15 minutes put me in "uptrend" mode early which turned out to be wrong and perhaps the sudden drop off in volume after 9:45 (together with narrow price range) was the warning.
Any thoughts on interpreting volume in this way?
Attachments
Last edited: