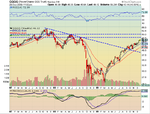
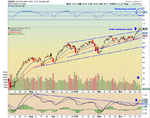
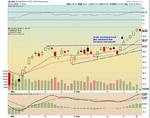
I've applied some trend lines to QQQQ as seen in the charts below and I'd like some advice. I'd like to learn more about the interrelationship between RSI/MACD/volume and price, as well as some kind of confirmation that I'm on track with the lines.
Any technical reasons whether or not this is a good position to get into for the short term (1 to 2 week)?
Any technical reasons whether or not this is a good position to get into for the short term (1 to 2 week)?
Attachments
Last edited:
