Hi All,
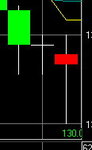
The stock price has dropped three days in a row then it forms a (Please refer to the second picture the small one) hammer like formation (Open 141.5, High 142, Low 135, Close 138), Second day it forms like a doji ( Open 138, High 139, Low 135, Close 138), Two straight days the low was 135 making a tweezer bottom, but the third day (Open136, High 139, Low 130, Close 137), the high was 139 same as yesterday is this a tweezer top? the day end like a hammer with a long shadow...Can someone help me with this problem if this is a bottom formation or just a beginning of another drop.
Thanks..
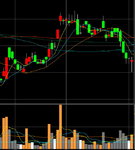
P.S: The first picture the big one is the picture of the whole trend...
The stock price has dropped three days in a row then it forms a (Please refer to the second picture the small one) hammer like formation (Open 141.5, High 142, Low 135, Close 138), Second day it forms like a doji ( Open 138, High 139, Low 135, Close 138), Two straight days the low was 135 making a tweezer bottom, but the third day (Open136, High 139, Low 130, Close 137), the high was 139 same as yesterday is this a tweezer top? the day end like a hammer with a long shadow...Can someone help me with this problem if this is a bottom formation or just a beginning of another drop.
Thanks..
P.S: The first picture the big one is the picture of the whole trend...