Current Spreads January

fastnet

Well-known member
Messages
305
Likes
1
Yesterdays trades (5th Dec) - all MOC

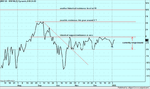
I closed out my remaining LH position (April -Feb) - B1 Feb LH @ 64.55 S1 April LH @ 67.70 close spread 3.15

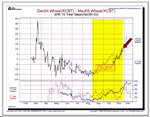
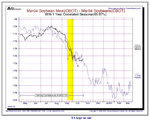
I opened one live cattle spread June - August B1 M LC @ 87.45 S1 Q LC @ 86.15 open spread 1.3

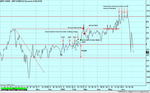
I tried to open the June - December LH spread but my broker advised that the Dec contract was very illiquid. I cancelled the trade but am unsure how much of a problem this might be. If it's just a few cents in one leg of a trade that might last two months then I don't see a problem.

Could anyone elaborate on the possible problems?

Thanks

FN
 
LIvermore on liquidation

Livermore in Reminiscences explains the problem with a lack of liquidity.
Livermore> No money anywhere, and you can't liquidate stocks because there is nobody to buy them.
You cannot get out!
fastnet said:
I cancelled the trade but am unsure how much of a problem this might be. If it's just a few cents in one leg of a trade that might last two months then I don't see a problem.
 
Last edited:
insatiable

fastnet said:
Hi GT - given that hedge funds and other financial institutions are moving into spreads wholesale do you think this will have a major impact on the reliability of historical patterns?
No!
Is this already happening to some degree?
Yes, Joe said something about it.
Presumably until fairly recently only commodity firms and some private traders were trading this way?
Still
I'm sure the sums involves have always been large but the move rise of the hedge fund over the past 5-8 years seems unstoppable and their hunger for new unconventional investment vehicles insatiable.
snake-eat.jpg
Spreads are conventional.

Trade’um
 
Okay - thanks GT - got to admit though I go to bed more confused about spreads and MRCI charts than I have in the past 6 months. I've been trawling through the ''special spread charts'' - I looked at Soyabeans, Corn, Live Cattle and wheat. Each time a trade looks good I do the ''Kato check'' (see discussion in tail end of December spreads thread) and realise that the trade has probably already played out based on the ACTUAL spread value in the last 15 years. MRCI's 15 vs current and current vs highly correlated charts are VERY confusing - I really don't see the point in any values on the vertical axis if they don't mean anything. . . . . .

Yours v confused - FN
 
Okay - looked again in detail today. I have also looked out some of the charts I printed off when I initiated trades and compared them with the charts shown in ''spread trade portfolio'' on MRCI. This is where there is a collection of recent trades that have already played out.

Consider the main chart only for the moment. (the one with 15 yr blue line vs current market and 5 year vs 15 year 0 to 100 below it.) The most important point is that the verticle axis changes throughout the trade.

Take my recent buy April sell Feb 06 Lean Hogs trade as an example. When I opened the trade on the 1st Dec this main chart showed the current price at the bottom of a blue 15 curve that went right up to a +10 spread. This was within the yellow highlighted ''highly correlated'' area. IF I had looked at the ACTUAL spreads over the last 15 years I would have noticed that this spread had only briefly exceeded +7 once in 98 during the past. In the past 5 years the +4 to +6 range is realistic. However +10 (as the main chat appears to suggest) is not.

Now fast forward to yesterday and the portfolio review section of MRCI's site shows the very same chart but with +4 as the max achievable. Using this y-axis their trade now looks very successful. Surely this is overtly moving the goalposts??

My question therefore is simple. Why do the main charts EVER show prices that are unlikely to be achieved (on the basis that they haven't in th past 15 years) in the early stages of these trades?? I think this deceives the naive (me) and provides little value to the experienced.

I'd love to hear some opinion about this - especially from some of the more experienced guys.

I don't mind admitting that this revelation has really shaken my confidence in the viability of spreads. The risk/reward aspects that are so attractive appear to be an illusion.

Best regards,

Fraser
 
mw n6 - mw u6

Hi FN

I've posted a reply to your question in the December thread here just to keep things current.

MW N6 - MW U6 Looks like a potential trade to me. I like the convergence of the 5 & 15 yr historical patterns which show a downtrend from late Dec into early April, the monthly chart shows prominent resistance at +10 which leaves good room for the trade to develop, if I took this trade my own trade management would dictate watching the +5 (approx) level for possible resistance following the Sept05 high and looking to take some profits here. The price action is currently range-bound but has just put in a higher low (03/01/06).
What are your thoughts on an entry signal for this spread?

N.B. check with your broker regarding liquidity, volume looks thin at the moment
 

Attachments

  • mwu6-mwn6.png
    mwu6-mwn6.png
    88.7 KB · Views: 344
Last edited:
Form fitting

Form fitting
Hybrid Thread
In my own words, lets say hypothetically. The chart at the bottom that you prefer, shows when highs and lows are likely to occur. Nothing to do with price. Just when. Lows at harvest, highs later on. Bernstein teaches how you can isolate up times and down times on your own if you need more of this.
fastnet said:
Now fast forward to yesterday and the portfolio review section of MRCI's site shows the very same chart but with +4 as the max achievable.
"max achievable?" What a bunch of baloney.
Using this y-axis their trade now looks very successful. Surely this is overtly moving the goalposts??
Show me the charts, no abbreviations, no hieroglyphics, just show me the charts. Even in a carrying charge market no one can foresee the “max achievable.”
My question therefore is simple. Why do the main charts EVER show prices that are unlikely to be achieved.
I laugh when I see the comments made about price. How can you compare numbers today with illusionary illusive values that have no relevance to today from the past?

Are you adjusting for inflation, have you considered the increasing money supply?

What about the population, a baby was born in China today, did you factor that into the relative value of your numbers?

At a minimum you would need to use numbers adjusted to gold. How much gold did that number represent then, how much does it represent now?

Using any currency is like walking on smoke. How much currency did it take to buy this at a moment in time?

How much will it take today?

Completely different stores of value. Seasonal traders are not price level traders. No matter what the supposed value of the certificates of guaranteed confiscation printed by the governments. The commodity still bottoms at harvest, expires at expiration.

Seasonal patterns are a reflection of climate. Currency is the McGuffin in the story. What does the fleeting value of political currency have to do with it?

The trend is your friend.

OK let’s say by some mysterious means our research department has isolated a consistent pattern that we agree to call the seasonal pattern, because it happens seasonally.

They find a one-year, two-year, all the way up to all available data, 30 years or more. Data to far out is worth less. Data to close is unpredictable. So we settle on five to maybe twenty years for trading.

For comparison we blow the highs out to 100% and drop the lows to zero. This is what the chart shows. When to expect troughs and crests. Data primarily starts a year back and goes farther away the longer time span you use.

Next we take the current spread. This spread is shown against the current value of currency. Now for the sake of visualization, suppose the spread has already been trading for six months. We are not trading it yet, because there is not enough volume. The commercials are not in it yet; they pay us premiums to provide them liquidity. Therefore, what we do is take the seasonal spread and try to fit it (overlay), to the six months data.

So what we are saying is, based on the previous six months data, here is where prices are expected to go if the pattern continues today as it has in the past. What the numbers were in the past is totally irrelevant because today’s currency is continually being degraded.

What a joke. All the bankers of the world are laughing at price watchers. You can’t buy with today’s currency what you could have bought with currencies of the past. It would have to be a major mental defect to think that one unit of ancient currency has any real relation to current values. Why do you think countries get in debt?

If they pay it back at all, they pay it back with currency worth less?

All currency has the same fate. None can be used reliably as a measure of value over time. It is the pattern that matters. You have seen it. Many, many, times prices below the mean, have caught up and closed right where the projection, anticipated on the last day. Amazing!

It just means it closed where it should, relative to the previous six months data. Pretty much, that’s it. The seasonal gives us a day-by-day road map. However, it often closes relative to its own pattern. This pattern is probably being refitted continuously as the market produces more data.
 

Attachments

  • Wheat Finish.jpg
    Wheat Finish.jpg
    481.2 KB · Views: 362
Correlations

Correlations
Hybrid Thread
fastnet said:
MRCI's 15 vs current and current vs highly correlated charts are VERY confusing - I really don't see the point in any values on the vertical axis if they don't mean anything. . . . . .
Ok, the 15-year pattern is made up of many individual years. Some follow this years price closer than others. If the years showing the greatest correlations follow the 15-year, what would be the reason of drawing your attention to it?

None!

However, when we see a year, or worst a few years that follow the current prices, but then deviate in the future. These we want to know about. Hence, the correlation studies.

The longer-term pattern is the way to bet. However, when we suspect that a few horses are about to leave the track early, we better look for a break in the rail. The whole point of this is that the factors that move markets may have been similar in those wayward years, and may be repeating in the current environment. They are not usually as obvious as the upcoming Cattle report. In these cases the seasonal usually continues, it just waits to absorb the report before commencing, as shown by the correlation chart.

Therefore, the seasonal chart suggests the “pattern of waves.” The overlay shows the pattern against the “current value,” of ever depreciating paper. The correlation studies show likely “alternate scenarios.”

Our job is to hold a portfolio of profitable spreads.
 

Attachments

  • 1 year Correlation.jpg
    1 year Correlation.jpg
    426.6 KB · Views: 381
Winter

Winter
Hybrid Thread
Just looking at the chart not seriously. It looks like the product was in short supply until Labor Day. It was probably harvested until early October. Then it went to sleep. It is probably under a blanket of snow right now. Do you know how to tell a snake from a piece of rope?
Kato said:
The price action is currently range-bound but has just put in a higher low (03/01/06) … volume looks thin at the moment.
What are your thoughts on an entry signal for this spread?
How can you expect a break out on low volume, are you going to trade in the box?
What does the seasonal suggest?
Divergences, trendlines should help.

P.S. A snake moves.
 
Hello again. Anyone taking another look at LCJ6/FCJ6 spread that was discussed earlier. It has finally turned profitable for me. Wondering if anyone else willing to enter the spread as it stands now ?

Also, yesterday I entered a Long July '06/ Short October '06 Lean Hogs spread. Any thoughts ?

Jxntntrader
 
Hi jxntn - I did look at this trade again last night. It's great that it's has now turned profitable for you but I'm not sure there are yet true signs that this trade has turned the corner. Of course it may well have done but I can't see that from the chart today. No new low has been made - what I want to see now is a convincing break out of the downtrend channel - I'll forfeit some of the move but I had my fingers burnt last year buying prematurely into the downtrend in crude and learnt a hard lesson. In summary the trade looks a lot stronger but I'm taking a wait and see approach.

Hogs have been very good for me in the last few months. In fact my account has grown 25% on the back of two successful, slightly pyramided, hog trades. Long July '06/ Short October '06 doesn't look as attractive somehow. It seems to me that the move is already well underway. I'm not sure how much profit there is left. Only my opinion which is also tainted by a feeling of not wanting to push my luck a third time with the same contract.
I'm thinking of increasing my June- August Live Cattle MOC today.
 
Hello again fsn. This thread has gotten quiet again. Yesterday I entered the HOM6/HOH6 spread. As usual the spread was entered approximately $150 off from the close. My broker enters the spread in the NYMEX session just after close.

The cattle and lean hog spreads took a hit yesterday, but all of the spreads are early, at least if you're using the MRCI strategies so drawdown is expected.

Tell us how you're trades are going.
 
Kato said:
Hi FN

I've posted a reply to your question in the December thread here just to keep things current.

MW N6 - MW U6 Looks like a potential trade to me. I like the convergence of the 5 & 15 yr historical patterns which show a downtrend from late Dec into early April, the monthly chart shows prominent resistance at +10 which leaves good room for the trade to develop, if I took this trade my own trade management would dictate watching the +5 (approx) level for possible resistance following the Sept05 high and looking to take some profits here. The price action is currently range-bound but has just put in a higher low (03/01/06).
What are your thoughts on an entry signal for this spread?

N.B. check with your broker regarding liquidity, volume looks thin at the moment

Hi Guys,

I noticed the resistance levels at 5 & 10 came into play on this MW spread we discussed back in Jan, I find these potential resistance levels to be critical in selecting trades, are you still trading the spreads FN & Jxtn ?
 

Attachments

  • MW spread review.png
    MW spread review.png
    112.7 KB · Views: 239
Parabolics long

Trendline
Parabolic has been long for over a week now. Bollinger had a bullish squeeze (whatever that means), before lift off, & Stochastic has been showing a bullish divergence since May. What was the question?
 

Attachments

  • Mw spread.jpg
    Mw spread.jpg
    85 KB · Views: 220
  • Bollinger.jpg
    Bollinger.jpg
    94.6 KB · Views: 215
  • Sto.jpg
    Sto.jpg
    106.3 KB · Views: 223
Last edited:
Top