Yesterday's prep was interesting
I showed charts from the previous week and month
to illustrate typical patterns
I also showed students how to program their order entry
software so that they could automate profit taking. On "trading range"
days (like today), this is critical. If you enter using a limit order and get
filled, the result is all about management. If you get filled at the edge
of the market, and you have properly programmed your profit taking
all you do is wait. If on the other hand the market moves against you
its about judgement. You have to be willing to scale in (once) higher
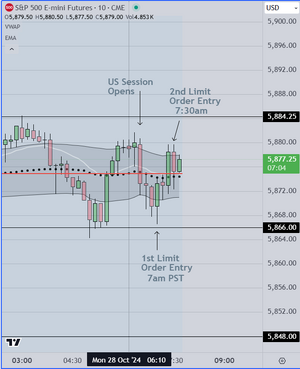
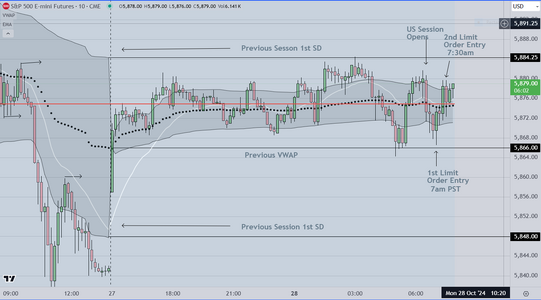
or lower. Today was a good day for limit order traders. The horizontal
lines were put in place prior to the open, and represent the previous
VWAP, and the 1st SD on each side. Notice how price stays inside the
boundaries. We programmed profit taking at 5 pts and got filled both
times for a total of +10
About half the students took the trades, and interestingly ALL of them
exited prior to the 5 pt automated entry. In other words, NONE of them
could manage their own emotions long enough to get the full 5 pts.
They all said the same thing. The anxiety they felt while waiting was
too much, and they pulled the trigger to exit manually after only a
point or two.
From my point of view, this is one of the primary lessons that retail
traders have to learn (if they want to do this for a living). The bottom line
is that IF a trader doesn't learn to manage their own emotional response
to uncertainty, then they will not be able to overcome the periodic losses
that are part of the business.
I showed charts from the previous week and month
to illustrate typical patterns
I also showed students how to program their order entry
software so that they could automate profit taking. On "trading range"
days (like today), this is critical. If you enter using a limit order and get
filled, the result is all about management. If you get filled at the edge
of the market, and you have properly programmed your profit taking
all you do is wait. If on the other hand the market moves against you
its about judgement. You have to be willing to scale in (once) higher
or lower. Today was a good day for limit order traders. The horizontal
lines were put in place prior to the open, and represent the previous
VWAP, and the 1st SD on each side. Notice how price stays inside the
boundaries. We programmed profit taking at 5 pts and got filled both
times for a total of +10
About half the students took the trades, and interestingly ALL of them
exited prior to the 5 pt automated entry. In other words, NONE of them
could manage their own emotions long enough to get the full 5 pts.
They all said the same thing. The anxiety they felt while waiting was
too much, and they pulled the trigger to exit manually after only a
point or two.
From my point of view, this is one of the primary lessons that retail
traders have to learn (if they want to do this for a living). The bottom line
is that IF a trader doesn't learn to manage their own emotional response
to uncertainty, then they will not be able to overcome the periodic losses
that are part of the business.
Attachments
Last edited: