Most consider the father of technical analysis (the science of forecasting market movements based on price patterns) to be Charles Dow, the founder of Dow Jones and Company which publishes the Wall Street Journal. Around 1900 he wrote a series of papers which looked at the way prices of the Dow Jones Industrial Average and the Dow Jones Transportation Index moved. After analyzing the Indexes he outlined his belief that markets tend to move in similar ways over time. These papers, which were expanded on by other traders in the years that followed, became known as "Dow Theory".
Although Dow Theory was written over 100 years ago most of its points are still relevant today. Dow focused on stock indexes in his writings, but the basic principles are relevant to any market.
Dow Theory is broken down into 6 basic tenets, which we take a look at below.
The first tenet of Dow Theory is that The Markets Have 3 Trends.
To help better understand each trend lets look at an example of each:
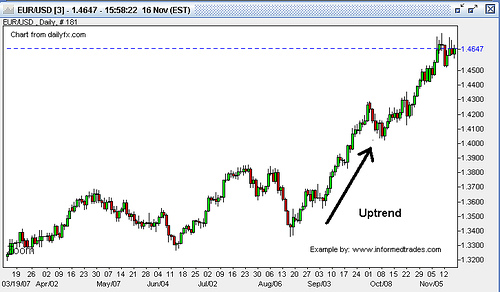
caption: A Price Chart Showing an Up Trend
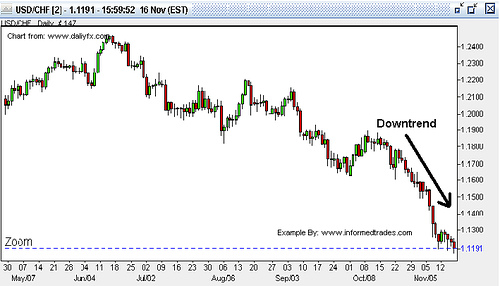
caption: A Price Chart Showing a Down Trend
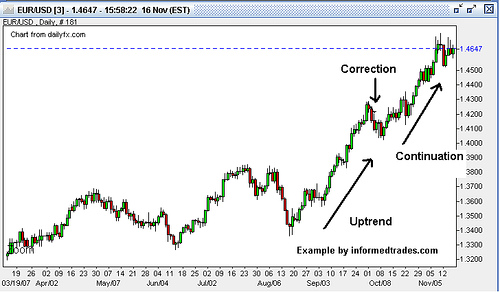
caption: A Price Chart Showing a Correction
The second tenet of Dow Theory is that Trends Have 3 Phases:
Here you can start to see how the psychology of investors and traders comes into play an important concept which we will delver deeper into in later lessons.
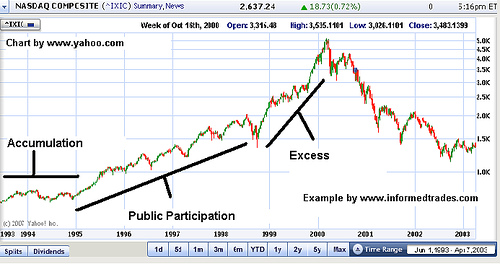
One of the best examples which shows these three phases occurring in an uptrend that most people are familiar with is the run-up up the NASDAQ into 2000:
Chart of the NASDAQ Showing the 3 Phases of a Trend:
The third tenet of Dow Theory is that The Markets Discount All News, meaning that once news is released it is quickly reflected in the price of an asset. On this point Dow Theory is in line with the efficient market hypothesis which states that:
This concept that the markets discount all news is one that is sited in arguments in favor of using technical analysis as a tool to profit from the markets as if it is true that markets already discount all fundamental factors then the only way to beat the market would be through technical analysis.
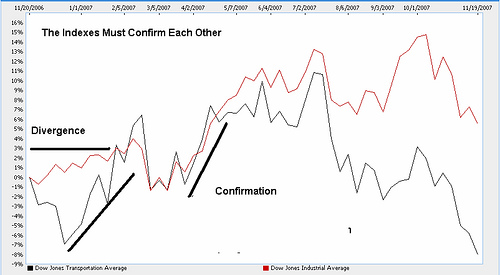
Tenet four of Dow Theory is that The Averages Must Confirm Each Other. The averages must confirm each other. Here Dow was referring to the Dow Jones Transportation Index and the Dow Jones Industrial Average. To understand this point it is important to remember that in Dow's time the growth in the US was coming mainly from the Industrial sector. These two indexes were made up of manufacturing companies and the rail companies which were the primary method used to ship the manufacturers goods to market. What Dow was basically saying here is that you could not have a true rally in one of the averages without a confirmation from the other because if manufacturer's profits were rising they would have to ship more goods. This meant that the profits of the transportation companies and therefore the transportation average should rise too. Dow stated that when these two averages moved in opposite directions it was a sign that the market was going to change direction.
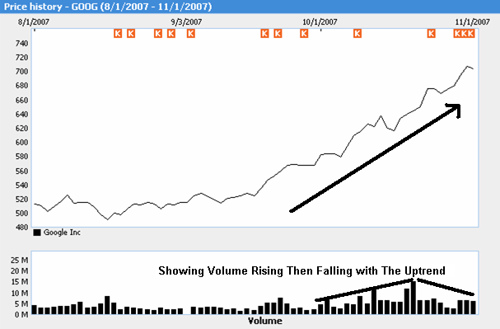
Tenet five is Trends Are Confirmed by Volume. What Dow was saying here was that there are many reasons why price may move on low volume, but when prices move on high volume there is a greater chance that the move is representative of the overall market's view. Dow believed that if many traders were participating in a particular price move and the price moves significantly in one direction, then this was an indication of a trend developing as this was the direction the market was anticipated to continue to move.
Tenet six is that Trends Exist Until Definitive Signals Prove That They Have Ended. What Dow was saying here is that there will be market moves which are against the primary trend but this does not mean that the trend is over and the market will normally resume its prior trend. There is much debate on how to best determine when a definitive signal has been given that the trend is over and this is where our study of technical analysis in future lessons will take us.
Now that you have read this article you should have a basic understanding of the background of how prices move and what market technicians look for as the foundation of their analysis.
Although Dow Theory was written over 100 years ago most of its points are still relevant today. Dow focused on stock indexes in his writings, but the basic principles are relevant to any market.
Dow Theory is broken down into 6 basic tenets, which we take a look at below.
The first tenet of Dow Theory is that The Markets Have 3 Trends.
- Up Trends which are defined as a time when successive rallies in a security price close at levels higher than those achieved in previous rallies and when lows occur at levels higher than previous lows.
- Down Trends which are defined as when the market makes successive lower lows and lower highs.
- Corrections which are defined as a move after the market makes a move sharply in one direction where the market recedes in the opposite direction before continuing in its original direction.
To help better understand each trend lets look at an example of each:
caption: A Price Chart Showing an Up Trend
caption: A Price Chart Showing a Down Trend
caption: A Price Chart Showing a Correction
The second tenet of Dow Theory is that Trends Have 3 Phases:
- The accumulation phase which is when the "expert" traders are actively taking positions which are against the majority of people in the market. Price does not change much during this phase as the "experts" are in the minority so they are not a large enough group to move the market.
- The public participation phase which is when the public at large catches on to what the "experts" know and begin to trade in the same direction. Rapid price change can occur during this phase as everyone piles onto one side of a trade.
- The Excess Phase where rampant speculation occurs and the "smart money" starts to exit their positions.
Here you can start to see how the psychology of investors and traders comes into play an important concept which we will delver deeper into in later lessons.
One of the best examples which shows these three phases occurring in an uptrend that most people are familiar with is the run-up up the NASDAQ into 2000:
Chart of the NASDAQ Showing the 3 Phases of a Trend:
The third tenet of Dow Theory is that The Markets Discount All News, meaning that once news is released it is quickly reflected in the price of an asset. On this point Dow Theory is in line with the efficient market hypothesis which states that:
?the efficient market hypothesis (EMH) asserts that financial markets are "informationally efficient", or that prices on traded assets, e.g., stocks, bonds, or property, already reflect all known information and therefore are unbiased in the sense that they reflect the collective beliefs of all investors about future prospects.? Source: Wikipedia
This concept that the markets discount all news is one that is sited in arguments in favor of using technical analysis as a tool to profit from the markets as if it is true that markets already discount all fundamental factors then the only way to beat the market would be through technical analysis.
Tenet four of Dow Theory is that The Averages Must Confirm Each Other. The averages must confirm each other. Here Dow was referring to the Dow Jones Transportation Index and the Dow Jones Industrial Average. To understand this point it is important to remember that in Dow's time the growth in the US was coming mainly from the Industrial sector. These two indexes were made up of manufacturing companies and the rail companies which were the primary method used to ship the manufacturers goods to market. What Dow was basically saying here is that you could not have a true rally in one of the averages without a confirmation from the other because if manufacturer's profits were rising they would have to ship more goods. This meant that the profits of the transportation companies and therefore the transportation average should rise too. Dow stated that when these two averages moved in opposite directions it was a sign that the market was going to change direction.
Tenet five is Trends Are Confirmed by Volume. What Dow was saying here was that there are many reasons why price may move on low volume, but when prices move on high volume there is a greater chance that the move is representative of the overall market's view. Dow believed that if many traders were participating in a particular price move and the price moves significantly in one direction, then this was an indication of a trend developing as this was the direction the market was anticipated to continue to move.
Tenet six is that Trends Exist Until Definitive Signals Prove That They Have Ended. What Dow was saying here is that there will be market moves which are against the primary trend but this does not mean that the trend is over and the market will normally resume its prior trend. There is much debate on how to best determine when a definitive signal has been given that the trend is over and this is where our study of technical analysis in future lessons will take us.
Now that you have read this article you should have a basic understanding of the background of how prices move and what market technicians look for as the foundation of their analysis.
Last edited by a moderator: