Hi all, this is my second day on the forum so Ithought I would contribute to the systems section. I have a passion for system design and I'm eager to learn as much as I can and this, in my opinion, is a great way to do that.
I have spent many hours designing and testing short term trading strategies and my experince has shown that finding a large enough edge that will overcome our worst enemies, commission and slippage, is tough to say the least. Persistance does pay, however, and today I will share with you a method that has great potential.
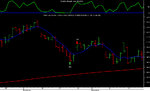
The systems basic premise is to look for overbought and oversold markets and then enter with a unique entry technique, a technique that goes against our natural tendencies, but one that is very powerful. I first came across this concept some time ago through Larry Connors. Larry and his team performed extensive research on a number of indicators and found the RSI to give one of the best edges. The twist, however, was that they were using a 2 period RSI instead of the default 14 period recommended by Welles Wilder, the developer. Results showed that 98 and 2, being overbought and oversold, were the optimal setup areas for the 2 period RSI. I have desigend a number of successful strategies around this concept, one of which I'll share with you today.
This system is a long only system and uses end of day data for all calculations. To start we will filter all stocks by trading those above their 200ma. This boosts system performace and will keep us away from stocks that are in long term down trends. Next, we will look for shares with a 2 period RSI value below 2. What most people do with oversold conditions is look to enter on strength by buying a 2 day breakout or some combination of that, but we are better than most people, and so we will look to enter the following day on even further weakness. Yes, further weakness! We will place orders in the market to buy our setup shares if they drop by 3% from todays close tommorrow.
If the orders are not filled we wait for another setup. The exit strategy, once we are in a trade, is very simple; exit on the close when the close crosses above the 5 period MA of the close. That's it, and it works!
The system logic is sound. We are looking for oversold conditions and take it further by buying at a discount from a minor panic sell off. Once in we look to exit at a premium into strength, prefrably to someone filled with greed. Because our orders run counter to the trend slippage is not a major problem as it is with breakout trading.
I have attched all the testing results. The systems was tested on the S&P500 constituents with constant equity of $100 000 (i.e. no compounding of profits), 0.1% commission, shares were geared 10 times and the financing charges for the leverage at 8%. Risk on each trade is 1%, calculated on 5% of the entry price. This would be very similar to what you could do with equity CFD's.
I am very interested in comments, improvements, ideas etc. Let me know what you think?
I have spent many hours designing and testing short term trading strategies and my experince has shown that finding a large enough edge that will overcome our worst enemies, commission and slippage, is tough to say the least. Persistance does pay, however, and today I will share with you a method that has great potential.
The systems basic premise is to look for overbought and oversold markets and then enter with a unique entry technique, a technique that goes against our natural tendencies, but one that is very powerful. I first came across this concept some time ago through Larry Connors. Larry and his team performed extensive research on a number of indicators and found the RSI to give one of the best edges. The twist, however, was that they were using a 2 period RSI instead of the default 14 period recommended by Welles Wilder, the developer. Results showed that 98 and 2, being overbought and oversold, were the optimal setup areas for the 2 period RSI. I have desigend a number of successful strategies around this concept, one of which I'll share with you today.
This system is a long only system and uses end of day data for all calculations. To start we will filter all stocks by trading those above their 200ma. This boosts system performace and will keep us away from stocks that are in long term down trends. Next, we will look for shares with a 2 period RSI value below 2. What most people do with oversold conditions is look to enter on strength by buying a 2 day breakout or some combination of that, but we are better than most people, and so we will look to enter the following day on even further weakness. Yes, further weakness! We will place orders in the market to buy our setup shares if they drop by 3% from todays close tommorrow.
If the orders are not filled we wait for another setup. The exit strategy, once we are in a trade, is very simple; exit on the close when the close crosses above the 5 period MA of the close. That's it, and it works!
The system logic is sound. We are looking for oversold conditions and take it further by buying at a discount from a minor panic sell off. Once in we look to exit at a premium into strength, prefrably to someone filled with greed. Because our orders run counter to the trend slippage is not a major problem as it is with breakout trading.
I have attched all the testing results. The systems was tested on the S&P500 constituents with constant equity of $100 000 (i.e. no compounding of profits), 0.1% commission, shares were geared 10 times and the financing charges for the leverage at 8%. Risk on each trade is 1%, calculated on 5% of the entry price. This would be very similar to what you could do with equity CFD's.
I am very interested in comments, improvements, ideas etc. Let me know what you think?