Who says there's no such thing as a leading indicator? 🙂
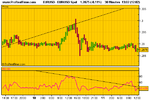
Yesterday's 30-minute chart of the Euro/USD showed a brilliant example of negative divergence in the RSI. Trading this produced an easy 100-point profit (up to 150 points available with care over entry and exit) in a couple of hours ... (see attached chart).
Yesterday's 30-minute chart of the Euro/USD showed a brilliant example of negative divergence in the RSI. Trading this produced an easy 100-point profit (up to 150 points available with care over entry and exit) in a couple of hours ... (see attached chart).