Breakout System Backtest / Walk Forward Results YM 12 Years

leinster

Newbie
Messages
9
Likes
0
Looking for feedback on the following.

This is a breakout system i have made and was wondering what people thought in terms of what should be improved.

Win ratio very low, but im looking to run it mechanically on the markets.

Tested on YM from 1998 - 2010 feedback appreciated.

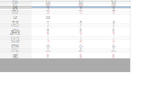
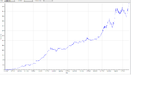
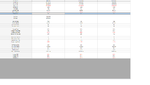
Also attached (dodgy looking equity curve and yearly breakdown).

Anything i should watch out for?
 

Attachments

  • Output.png
    Output.png
    74.3 KB · Views: 699
  • output2.png
    output2.png
    63.1 KB · Views: 920
  • output4.png
    output4.png
    87.1 KB · Views: 608
I think it looks great. All REAL equity curves are a bit dodgy I think. Tell me the system so I can code it now!

The problem is that maybe it is losing it's spunk recently. There are a few spikes. But hey, that's the way the market works. It's still climbing.
 
Sorry I'm not familiar enough with YM to work out what 0.08% per trade is in dollars. Does that give you enough to cover commissions and slippage?
 
commision would be 13K on this in total.
based on 1YM 5 dollar mini trade.

scaling obviously increases originally a 7k account.

so 14k account double but commission stays the same.

works out as profit of 42 bucks a trade average.
 
Looks good. What's the timeframe you're trading it on?

How much data have you forward tested it on? (& what were the results?)

Try testing it on crude oil, GBP/USD, and any other markets you might have data for.
 
15 / 30 /45 minute timeframe ran it on 200-500 stocks appears profitable. Thats a 45 minute output.

Working on another one for 15 good bit different but looking ok.

Awaiting some data to run on crude etc (too arrive in post) but from trading crude it will probably work on it but not so on rangebound currency markets.
 
Crude is a weird market with that ramp up two years ago and then back down again. The same thing happened in gold in ...er was 1980?

You ran it on stock charts? wow.

What did it do in the 'flash crash' this May just gone? Not that it's mega-important, hopefully the stock exchanges will sort out the HFR rules and prevent that happening again.

The volatility of the last 2 years is reflected well in the equity curve. If we see a lot more of that, then it's probably not good for you.
 
For may it was out of the market and not involved. Just after flash crash on way back up it made a loss but stopped out. It made good money in may prior to crash the drop dow to 01/12/2008 was worst month with -6.66% DD best month on other side was 01/03/2009 with 24.53% .

Any ideas for sorting out volatility ?
 
Any ideas for sorting out volatility ?

OK, interesting. It looks good, better than most of the systems I ever came up with.

As for volatility, I don't do anything special other than plan my money management for the most volatile times and always use that level. I use (or would use if my account got any bigger) fixed fractional allocation of capital per system based on maximum forecast loss on one trade.

You could use Vix or ATR or something else entirely.

I think a much touted methodology is to ramp up your bet size as your trade goes your way but if you are quick in and out that won't work.
 
Thats interesting i must printout ATR and crossreference.

Here is results of an EMA crossover backtest.

OK, interesting. It looks good, better than most of the systems I ever came up with.

As for volatility, I don't do anything special other than plan my money management for the most volatile times and always use that level. I use (or would use if my account got any bigger) fixed fractional allocation of capital per system based on maximum forecast loss on one trade.

You could use Vix or ATR or something else entirely.

I think a much touted methodology is to ramp up your bet size as your trade goes your way but if you are quick in and out that won't work.
 

Attachments

  • ema_cross.png
    ema_cross.png
    72.8 KB · Views: 411
those are tolerable drawdown levels. If you switch to compounding before every position, you will see an increase in this. My advice, treat your drawdown as objective #1. It is easy to watch it go by on the testing screens, but watching 30-50% drain from your account live would be miserable. Wouldn't you rather know that you made a single dollar that day? A step toward your goal.

Anyway, this drawdown if very good :) Try to keep it :)

EDIT: Also, I use ATR in 90% of my automated systems and it has been wonderful. To make a bigger target profit, use a higher time frames ATR.
 
Leinster,

You'll probably get slippage on the YM even on one contract, there's no way to know how much but it will definitely affect the results. Why dont you run it on the ES or the Bund or Eurostoxx. They have 5 or 10 times the volume of the YM and have virtually no slippage assuming you don't trade 500 contracts at 4am.

The other advantage of the Eurex products (Bund, Eurostoxx) is lower commissions, around 2 euros per round trip or less. That would also positively affect your results.
 
Top