Help in amibroker

This is a discussion on Help in amibroker within the Trading Software forums, part of the Trading Tools category; Anyone can advise me how to get 2 different symbol(counter) display in the same sheet. I like to compare the ...

Reply
 
LinkBack Thread Tools Search this Thread
Old Jul 23, 2009, 6:41am   #1
Newbie
 
georgecheng's Avatar
 
Member Since Jul 2009
Default Help in amibroker

Anyone can advise me how to get 2 different symbol(counter) display in the same sheet. I like to compare the 2 different of them.

On top of that, once able to do that, is it possible to have the top chart in candlestick and the bottom one display as line?

I trying the whole day and can't find a solution for it.

Thanks
georgecheng is offline   Reply With Quote
Old Jul 23, 2009, 8:46am   #2
Legendary Member
 
Charlton's Avatar
 
Member Since Nov 2003
Default Re: Help in amibroker

Quote:
Originally Posted by georgecheng View Post
Anyone can advise me how to get 2 different symbol(counter) display in the same sheet. I like to compare the 2 different of them.

On top of that, once able to do that, is it possible to have the top chart in candlestick and the bottom one display as line?

I trying the whole day and can't find a solution for it.

Thanks
Have a look at windows layout in the user manual

Working with chart sheets and window layouts

Also look at the plot command and the stye types

Using graph styles, colors and titles in Indicator Builder

Charlton
__________________
Onwards and Upwards
Charlton is offline   Reply With Quote
Old Jul 23, 2009, 11:19am   #3
Newbie
 
georgecheng's Avatar
 
Member Since Jul 2009
Default Re: Help in amibroker

georgecheng started this thread
Quote:
Originally Posted by Charlton View Post
Have a look at windows layout in the user manual

Working with chart sheets and window layouts

Also look at the plot command and the stye types

Using graph styles, colors and titles in Indicator Builder

Charlton
Hi Charlton,

Thanks for the advice, I have already tried out these method pervious, but I still hoping to seek advice if it is possible to insert chart just like indicator. If that is the only way out, i guess have to stick to that.

Nevertheless have you use this step to add 'foreign chart'. Sorry I using Amibroker version 5.0. Under the 'Chart' Tab -> Basic Chart -> select Price(foreign)

If we key in other symbol, we able to add other chart in the same window, but the chart seem to be slightly different. You happened to know the reason for it?

Thanks
georgecheng is offline   Reply With Quote
Old Aug 7, 2009, 7:19pm   #4
Newbie
 
KelvinHand's Avatar
 
Member Since Jun 2008
Default Re: Help in amibroker

Quote:
Originally Posted by georgecheng View Post
Anyone can advise me how to get 2 different symbol(counter) display in the same sheet. I like to compare the 2 different of them.

On top of that, once able to do that, is it possible to have the top chart in candlestick and the bottom one display as line?

I trying the whole day and can't find a solution for it.

Thanks
Open in two floating window, align top and bottom. you will achieve it without much problem. KISS.
KelvinHand is offline   Reply With Quote
Old Aug 7, 2009, 7:24pm   #5
Newbie
 
KelvinHand's Avatar
 
Member Since Jun 2008
Default Re: Help in amibroker

Quote:
Originally Posted by georgecheng View Post
Hi Charlton,

Thanks for the advice, I have already tried out these method pervious, but I still hoping to seek advice if it is possible to insert chart just like indicator. If that is the only way out, i guess have to stick to that.

Nevertheless have you use this step to add 'foreign chart'. Sorry I using Amibroker version 5.0. Under the 'Chart' Tab -> Basic Chart -> select Price(foreign)

If we key in other symbol, we able to add other chart in the same window, but the chart seem to be slightly different. You happened to know the reason for it?

Thanks
Not sure what you means of slightly different.
The foreign chart plot a different color to differentiate it or
because your two symbol had two different price value ???
KelvinHand is offline   Reply With Quote
Old Dec 24, 2009, 4:16pm   #6
Newbie
 
darshan's Avatar
 
Member Since Dec 2005
Default Re: Help in amibroker

Quote:
Originally Posted by Charlton View Post
Have a look at windows layout in the user manual

Working with chart sheets and window layouts

Also look at the plot command and the stye types

Using graph styles, colors and titles in Indicator Builder

Charlton
hello ,
please check this ..i think this is what you want...
index is plotted as line and stock chart as candle..you can change index [ foreign symbol ]as per your sumbol you want to use

_SECTION_BEGIN("foreign ");
Vr="^NSEI"; // foreign symbol
SetForeign(Vr);
HaC =(O+H+L+C)/4;
HaO = AMA( Ref( HaC, -1 ), 0.5 );
HaH = Max( H, Max( HaC, HaO) );
HaL = Min( L, Min( HaC, HaO) );
Pl = ParamToggle("Plot Foreign","Off,On",1);
if(Pl==1){
PlotOHLC(HaO,HaH,HaL,HaC, ""+Vr+"", colorGrey50,styleLine|styleOwnScale);
}
RestorePriceArrays();
_SECTION_END();
PlotOHLC(O,H,L,C,""+Name()+"",47,64);
Attached Thumbnails
index-stock.png  
darshan is offline   Reply With Quote
Old Dec 30, 2009, 2:11am   #7
Junior Member
 
MTRIG's Avatar
 
Member Since Dec 2009
Default Re: Help in amibroker

Quote:
Originally Posted by georgecheng View Post
Anyone can advise me how to get 2 different symbol(counter) display in the same sheet. I like to compare the 2 different of them.

On top of that, once able to do that, is it possible to have the top chart in candlestick and the bottom one display as line?

I trying the whole day and can't find a solution for it.

Thanks
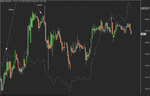
You can drop a chart on a pane as you do with an indicator. Go to a new work sheet an then File>New Blank Pane. On that blank pane drag a new price chart.

If you want candles on one chart and line on another chart you need to create a new price formula to drag to the new pane. Here is one I use to color the bars red/green.

If you have the default chart (view->Price Style->Candle) set to candle and you want the chart below as a line change GetPriceStyle() to styleLine before you save the formula below.


------------------------------------------------------------------------------------------------------------------------------------
SetChartOptions(0,chartShowArrows|chartShowDates);
_N(Title = StrFormat("{{NAME}} - {{INTERVAL}} {{DATE}} Open %g, Hi %g, Lo %g, Close %g (%.1f%%) {{VALUES}}", O, H, L, C, SelectedValue( ROC( C, 1 ) ) ));

ShowColors = Param("Show Colors 0=No 1=Yes", 1, 0, 1, 1 );
OneBarColor = ColorRGB( 66, 66, 135 );

BarColor = IIf(ShowColors ,IIf(Close == Open, colorBlack,IIf(Close>Open,colorGreen,colorRed)), OneBarColor );
Plot( C, "Close", BarColor, styleNoTitle | ParamStyle("Style") | GetPriceStyle() );
MTRIG is offline   Reply With Quote
Reply


Currently Active Users Viewing This Thread: 1 (0 members and 1 guests)
 
Thread Tools Search this Thread
Search this Thread:

Advanced Search


Similar Threads
Thread Thread Starter Forum Replies Last Post
Amibroker FTSE monkeybus Techies Corner 1 May 14, 2009 12:27pm
Hi, everybody, who uses AmiBroker with IB? miltonyoung First Steps 0 Jul 2, 2008 12:25pm
IB and Amibroker Stevemaster Trading Software 0 Jun 10, 2007 8:35pm
amibroker- newbie expensif First Steps 3 Jan 26, 2006 3:57pm
amibroker ANDRE17 Techies Corner 5 Nov 18, 2004 11:39am