Coding Basics in ProRealTime

D

Dowser

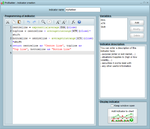
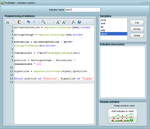
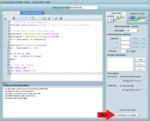
I thought I would start a thread about coding in ProRealTime. I know it's a popular platform, especially in the UK and I wanted to share what I've learnt so far. I should stress that I'm in no way an expert or a professional in this area and that this is aimed at people who have little or no coding experience. First off, I will show how to code an indicator. I was surprised that PRT didn't have a Keltner Channel indicator that is based on exponential averages - so this seems like a good place to start.
 
Last edited by a moderator:
Here's a clean 5 minute chart of the DOW. First click on the 'Indicator and Trading systems' icon. Next, click on the 'New' icon. Now we can type in a name for our indicator and start to define the variables by clicking on the 'Add' icon.
 

Attachments

  • Codepic1.png
    Codepic1.png
    92.1 KB · Views: 604
  • codepic2.png
    codepic2.png
    48.6 KB · Views: 542
  • codepic3.png
    codepic3.png
    34.7 KB · Views: 559
Variables are used to store data in a program, are referenced by a name and are assigned values.

Our first variable will be called EMA. It's value will be used to change the exponential average on which our keltner channel is based. Fill in the box as shown. 'Integer' just means a whole number and the 'Default Value' can be any whole number you like.

The next variable will be called ATR. It's value will be used to change the Average True Range on which our new indicator is based.

The last variable that needs to be defined will be called 'Shift'. It's value will be multiplied by Average True Range to change the distance of the channels from exponential moving average. Note that instead of a whole number we will allow it to float at any point on or between integers. Again, it's default value can be anything.
 

Attachments

  • codepic9.png
    codepic9.png
    31.3 KB · Views: 512
  • codepic8.png
    codepic8.png
    6.9 KB · Views: 401
  • codepic6.png
    codepic6.png
    7.5 KB · Views: 450
  • codepic5.png
    codepic5.png
    34.5 KB · Views: 438
  • codepic4.png
    codepic4.png
    7.4 KB · Views: 369
We can start typing the code in now. Note that 'centreline', 'topline' and 'bottomline' are also variables but the program assigns values to them as it runs. Also note that all the variables are coloured black. Functions coloured green are familiar indicators and are already coded into PRT. The word 'close' references the closing value of the bars, it could just as easily be 'open', 'high' or 'low'. To display the values assigned to the variables by the program we use 'return'. The terms in double quotes are labels that will appear in the settings box.

Here's the code to copy and paste:

centreline = exponentialaverage[EMA](close)
topline = centreline + averagetruerange[ATR](close)*shift
bottomline = centreline - averagetruerange[ATR](close)*shift
return centreline as "Centre Line", topline as "Top Line", bottomline as "Bottom Line"


When all the code is written click on the 'Add Indicator to Chart' icon.
 

Attachments

  • codepic10.png
    codepic10.png
    35 KB · Views: 552
The new indicator will now appear - underneath the price. This isn't traditionally where we'd expect a keltner channel! No matter, delete it and click the spanner icon on the price and add your new indicator from here. It will be listed along with all the other familiar indicators.
 

Attachments

  • codepic14.png
    codepic14.png
    146.9 KB · Views: 454
  • codepic13.png
    codepic13.png
    19.8 KB · Views: 455
  • codepic12.png
    codepic12.png
    83.7 KB · Views: 545
  • codepic11.png
    codepic11.png
    112.3 KB · Views: 495
This is how you modify an indicator. Instead of just one band on the Keltner indicator I am going to introduce another two.

In the settings window, with the indicator highlighted, click on the 'Modify Indicator' button. We need to modify the variable we named 'Shift' and also introduce two more variables. The values of these new variables will be multiplied by the Average True Range to give us channels of different widths.

As per post #3 new variables are introduced using the 'Add' button.

The last attachment shows the properties of the modified / new variables.
 

Attachments

  • codepic15.png
    codepic15.png
    123.8 KB · Views: 428
  • codepic16.png
    codepic16.png
    41.5 KB · Views: 487
  • codepic17.png
    codepic17.png
    13.3 KB · Views: 385
Last edited by a moderator:
Here is the code. Note the new variables listed and also the new variables created within the program: 'topline2' etc.

centreline = exponentialaverage[EMA](close)
topline = centreline + averagetruerange[ATR](close)*shift
bottomline = centreline - averagetruerange[ATR](close)*shift
topline2 = centreline + averagetruerange[ATR](close)*shift2
bottomline2 = centreline - averagetruerange[ATR](close)*shift2
topline3 = centreline + averagetruerange[ATR](close)*shift3
bottomline3 = centreline - averagetruerange[ATR](close)*shift3
return centreline as "Centre Line", topline as "Top Line", bottomline as "Bottom Line", topline2 as "Topline 2", bottomline2 as "Bottom Line 2", topline3 as "Top Line 3", bottomline3 as "Bottom Line 3"


Add the modified indicator to the chart.
 

Attachments

  • codepic18.png
    codepic18.png
    43.6 KB · Views: 482
  • codepic19.png
    codepic19.png
    156.6 KB · Views: 449
For the next example I will show how to create an indicator that sits separately underneath the price. This indicator is cross between Keltner Channels and a MACD. It displays the position of an EMA in relation to the width of the Keltner Channels as a percentage. It also has a signal line like the MACD.

This time we have five variables to define:

EMA of the Keltner Channels
Shift value to set width of the channels
Average True Range
EMA
Signal - An EMA of the position

Here is the code:

keltnercentreline = exponentialaverage[kema](close)

movingaverage = exponentialaverage[ema](close)

bottomline = keltnercentreline - shift*AverageTrueRange[atr](close)

channelwidth = 2*shift*averagetruerange[atr]

position = (movingaverage - Bottomline) / channelwidth * 100

signalline = exponentialaverage[signal](position)

Return position as "Position", signalline as "Signal"
 

Attachments

  • codepic20.png
    codepic20.png
    153.4 KB · Views: 466
  • codepic21.png
    codepic21.png
    25.5 KB · Views: 496
  • codepic22.png
    codepic22.png
    25.5 KB · Views: 428
  • codepic23.png
    codepic23.png
    36.1 KB · Views: 520
...And here it is. For some reason PRT adds random colour zones between lines. I don't think it improves the clarity but they are easy to remove. Indicators are very easy to customise. I've added a horizontal line at 50% and changed the colour of the signal. Equally, you could add lines to represent overbought/oversold conditions.
 

Attachments

  • codepic26.png
    codepic26.png
    164.8 KB · Views: 549
  • codepic25.png
    codepic25.png
    53.4 KB · Views: 457
  • codepic24.png
    codepic24.png
    180.6 KB · Views: 444
Coding a Screener

Ok, lets code a screener. These tools are used to filter instruments according to some user defined conditions. I thought a good practical example would be to code the '3 Ducks' system and use it to find FX pairs in BUY/SELL condition. For those unfamiliar with 3 Ducks: It gives a potential BUY or SELL signal when the price is above or below 60 period simple moving averages on three different time frames.

The first thing we need to do is create a list of the FX pairs we are interested in.

In the main window click 'Display' and select 'Lists'. In the new window find 'Major FX' in the drop down menu and click the spanner icon. Another new window will appear, click 'New' and enter a name for your new list.

You can now drag and drop the FX pairs that interest you. Pairs not listed here can be found using the search function.
 

Attachments

  • codepic27.png
    codepic27.png
    154 KB · Views: 541
  • codepic28.png
    codepic28.png
    5.5 KB · Views: 389
  • codepic29.png
    codepic29.png
    169.9 KB · Views: 433
  • codepic30.png
    codepic30.png
    23.9 KB · Views: 461
In the main window click 'Display' and then select 'ProScreener'. In the new window click the spanner icon and in the second new window click 'New'.

We now name our screener, select the list we created, change the time frame and click the tab labelled 'Creation by Programming'.

Here is the code:

timeframe (4 hours)
average4H = average[60](close)
condition1buy = close > average4H
condition1sell = close < average4H

if close > average4H then
criteria = 1
elsif close < average4H then
criteria = -1
endif

timeframe (1 hour)
average1H = average[60](close)
condition2buy = close > average1H
condition2sell = close < average1H

timeframe (5 minutes)
averageM5 = average[60](close)
condition3buy = close > averageM5
condition3sell = close < averageM5

screener [(condition1buy and condition2buy and condition3buy) or (condition1sell and condition2sell and condition3sell)] (criteria as "BUY/SELL")

Click the 'Execute ProScreener' button to launch the new screener.
 

Attachments

  • codepic36.png
    codepic36.png
    57.1 KB · Views: 373
  • codepic33.png
    codepic33.png
    63.8 KB · Views: 453
  • codepic32.png
    codepic32.png
    145.2 KB · Views: 700
  • codepic31.png
    codepic31.png
    129.5 KB · Views: 532
  • codepic37.png
    codepic37.png
    21.5 KB · Views: 474
Last edited by a moderator:
cbrads, how can we write( find out) screening code for high relative strength stocks(Not RSI) in pro real time ?i want to sort data based on Relative strength..
 
It doesn't look straightforward because the Relative Strength indicator isn't recognised in the proBuilder language. I'll have a good look this evening and get back to you. What is the benchmark for comparison?
 
Coding and back testing a trading system

This is a simple system that generates a buy signal when a 50 EMA is above a 90 EMA and a momentum indicator (Set to 3 periods) is above 100. Positions are closed when either a stop of 80 points is hit or a profit of 400 points is made. Only one position at a time can be open. Its runs on a 2 Hour chart of IG's spreadbetting DOW analogue. In simple systems like this one, ProRealTime allows a point and click approach to programming so no actual coding is necessary. Its a good way of learning the structure and semantics of ProBuilder enabling the user to quickly progress to more complicated systems.
 

Attachments

  • codepic38.png
    codepic38.png
    169.4 KB · Views: 428
Click the 'Indicators and trading systems icon'. Start a new back test and give it a name. Set the initial capital and the spread and then click the 'Buy' button. Click 'Add condition' and then on the price area of the chart. Enter the parameters. Clicking 'Add condition' again will enable us to enter the second set of parameters. This time we click on the momentum indicator. Click 'OK' to close the box. Click on 'Stops and Limits' to set them up. Finally, click 'Generate Code'.
 

Attachments

  • codepic39.png
    codepic39.png
    27.7 KB · Views: 460
  • codepic40.png
    codepic40.png
    62.9 KB · Views: 396
  • codepic41.png
    codepic41.png
    193.9 KB · Views: 338
  • codepic42.png
    codepic42.png
    16 KB · Views: 331
  • codepic43.png
    codepic43.png
    197.6 KB · Views: 397
  • codepic45.png
    codepic45.png
    88.6 KB · Views: 554
  • codepic44.png
    codepic44.png
    11.3 KB · Views: 323
We can back test our new code by clicking 'Back test my system'. Two new areas will appear on the chart: The equity curve and a histogram representing the positions. An new window with multiple tabs will also appear giving a more in depth analysis of the system's performance.
 

Attachments

  • codepic46.png
    codepic46.png
    84 KB · Views: 447
  • codepic47.png
    codepic47.png
    266.3 KB · Views: 367
  • codepic48.png
    codepic48.png
    196.1 KB · Views: 626
Last edited by a moderator:
cbrads, how can we write( find out) screening code for high relative strength stocks(Not RSI) in pro real time ?i want to sort data based on Relative strength..

Is a screener the right tool for the job? I say this because you'd just be comparing the ratio of one stock price and the index with next stock price and the index. I can't see how comparing these ratios would be of value. How do you define high relative strength stocks? I don't use relative strength myself so forgive me if I have misunderstood the concept.
 
Is a screener the right tool for the job? I say this because you'd just be comparing the ratio of one stock price and the index with next stock price and the index. I can't see how comparing these ratios would be of value. How do you define high relative strength stocks? I don't use relative strength myself so forgive me if I have misunderstood the concept.

high relative strength is effectively saying that one stock could be outperforming the index more than another. its a very effective comparison
 
Top