Konviction
Junior member
- Messages
- 30
- Likes
- 2
"Someone is sitting in the shade today because someone planted a tree a long time ago." - Warren Buffet
The major weekly and monthly trends that we see on our charts came from humble beginnings. They got their start on small intraday time frames, and like a snowball rolling down hill, it got bigger and bigger and bigger.
Of course not all trades will yield massive returns, but then again this isn't about hitting home runs every single time.
Using RSI and MACD histogram, I will do my best to ride momentum in the direction of the daily trend.
I plan on this being a "short term" buy and hold strategy (long and short) to squeeze every last bit of momentum from the trend, then sell the lifeless stock back to some poor fool who doesn't know any better 🙂
This system is brand new and still in the works, and I invite all to try it out and ask questions.
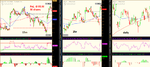
Here is what I'm using:
5min chart
14 RSI
MACD histogram default settings
20min chart
10 RSI
MACD 9,19,6 settings
1hr chart
7 RSI
6,13,4 settings
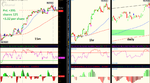
daily chart
30 EMA
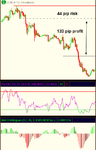
I always have a target of 3x my stop, or an RR or 1:3 at least.
The hard part is riding the bumpy waves and being confident that the trade will take me to a happy place.
I'll explain more of this as I go.
The major weekly and monthly trends that we see on our charts came from humble beginnings. They got their start on small intraday time frames, and like a snowball rolling down hill, it got bigger and bigger and bigger.
Of course not all trades will yield massive returns, but then again this isn't about hitting home runs every single time.
Using RSI and MACD histogram, I will do my best to ride momentum in the direction of the daily trend.
I plan on this being a "short term" buy and hold strategy (long and short) to squeeze every last bit of momentum from the trend, then sell the lifeless stock back to some poor fool who doesn't know any better 🙂
This system is brand new and still in the works, and I invite all to try it out and ask questions.
Here is what I'm using:
5min chart
14 RSI
MACD histogram default settings
20min chart
10 RSI
MACD 9,19,6 settings
1hr chart
7 RSI
6,13,4 settings
daily chart
30 EMA
I always have a target of 3x my stop, or an RR or 1:3 at least.
The hard part is riding the bumpy waves and being confident that the trade will take me to a happy place.
I'll explain more of this as I go.