Kevin21
Well-known member
- Messages
- 389
- Likes
- 18
MACD divergence
--------------------------------------------------------------------------------
Hey,
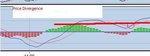
what exactly is a price divergence in a MACD indicator because i keep on coming across conflicting info. From people that i have spoken to who trade using a price divergence in the MACD indicator as one of their indicators, the positions they open saying that there is a divergence i fail to see... From what i learnt a price divergence can be seen in the MACD histogram, image is below. This is when the prices peaks, then makes a new higher peak, but the bars on MACD histogram fail to exceeded the high of the previous peak even tho its higher. What else qualifies as a divergences and what are the two lines for?
Many thanks
Kevin
--------------------------------------------------------------------------------
Hey,
what exactly is a price divergence in a MACD indicator because i keep on coming across conflicting info. From people that i have spoken to who trade using a price divergence in the MACD indicator as one of their indicators, the positions they open saying that there is a divergence i fail to see... From what i learnt a price divergence can be seen in the MACD histogram, image is below. This is when the prices peaks, then makes a new higher peak, but the bars on MACD histogram fail to exceeded the high of the previous peak even tho its higher. What else qualifies as a divergences and what are the two lines for?
Many thanks
Kevin