HMSO Head and shoulders top?

Paul Wilson

Junior member
Messages
46
Likes
3
Ok this is mainly for the tech heads ourt there.

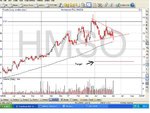
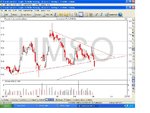
There seems to be a rather juicy pattern I have been keeping my eye on.

Seems to me like a head and shoulders top/triangle reversal which has formed.

Does this look viable to trade from a technical point of view?


I will post an image up as soon as I learn how.
 
HMSO Hammerson PLC FTSE 100 btw.

I have got 5 magic beans for anyone who can advise me how to post images/image links too.

Cheers - Paul.
 
HMSO Hammerson PLC FTSE 100 btw.

I have got 5 magic beans for anyone who can advise me how to post images/image links too.

Cheers - Paul.

hope your magic beans are good :cheesy:

1) edit first post or post a new reply
2) at the bottom you will have the option to "Go advanced" and click on it
3) then, below you will see "Attachments"....rest should be straightforward

j
 
Here goes...
 

Attachments

  • HMOS1.JPG
    HMOS1.JPG
    42.9 KB · Views: 344
Ok its a bit small. But I think it does the job.

jacinto, top work me ol mucker.

The beans have been dispatched fist class via carrier pigeon.
 
Also when I said is it tradable from a technical point of view I meant to say from a non fundamental point of view.

Thought I'd mention this before I get flamed...
 
thanks for the beans. :LOL:

dont trade shares, so wont comment. however, do you have a monthly chart for that too? would be interesting to see your triangle in context.

j
 
ok here are a couple more shots.

The first is as much history I could obtain. Since 03 it tooks like a tasty long hold. But what goes up...

Second is the pattern(s) a bit closer up. I understood triangles can be any time frame larger than 3 weeks. The H&S is obvious.

The neckline broke today confirming the H&S, also confirming the reversal break of the triangle and also the break of the trend line initiated in Jan 07.

I am expecting a bit of trouble at the 200 day MA though.


If there are any experienced pattern traders I would like to hear your feedback/comments.


Thanks - Paul.
 

Attachments

  • HMOS2.JPG
    HMOS2.JPG
    113.1 KB · Views: 335
  • HMOS3.JPG
    HMOS3.JPG
    119.2 KB · Views: 422
Also when I said is it tradable from a technical point of view I meant to say from a non fundamental point of view.

Thought I'd mention this before I get flamed...

I know Hammerson 'very' well Paul and be cautioned about disregarding fundamentals.

They are under the spotlight and may well be taken over. They have been atracted a bidder in the last month or so.

You may find the price suddenly shoots up with M&A activity.


Make sure your stops are in and emoitions are out and all that.

Also, check out the charts for British Land and Land Securities as these top three move together. I reckon Hammerson is best out of the crop and nice balance between office space and retail parks. British Land too much into office space and if markets turn I'm looking to shorting it with my pension... :cheesy:

Here is a quick comparison from FT's site on three biggest and best REITs in the UK. Land Securities and British Land have already taken a dive whilst Hammerson has gone strength to strength and holding support at £15 well.

As mentioned before investigate the company bid situation as if price dips there may well be more bidders especially after the recent take overs and interest in REITs in the US.

Good luck.
 

Attachments

  • HMSO.gif
    HMSO.gif
    13.3 KB · Views: 242
Last edited:
Atilla, thank you for your feedback and advice.


The reason why I disregarded the fundamentals is because basically I don't really know a great deal about them.

I have just spent the last year getting my head around charts and indicators.

If I had the financial resources and the time I would use fundamentals to aid with long long positions.

Unfortunately though as I am poor I will have to make do with swing trading.

Also thanks for posting the comparison chart. It was quite interesting to see.


I took the trade btw. Shorted when I had the chance. I was at work so I had no access to any real time data so I kinda just limped in.

I have covered the spread and am 15 ticks clear. I'm just about to move my stop to a more sensible position.

Regards - Paul.


Good move Paul,

With the melt down in the markets and possible rate rises it should shy from it's highs.
 
Hey gang. Been away, so here is a little update...

This is my first "serious" trade. The pattern broke as I thought it would. The price consolidated for a bit on the 200MA as I thought it would. I must admit I nearly bottled it at one point. 20/06 it got a bit lairy and I was going to cut the loss. I didn't, I stuck to my stops and it worked out fine.

Now I'm 141 ticks in the right side of the trade and still going!

This is possibly the first time i've been right about anything.


Cheers - Paul.
 
Top