Price action is what the price does. Nothing more, nothing else.
When people talk about price action they look at price bars (or candles), at support/resistance levels if they are derived from price chart as opposed to be derived from indicators. People use price action setups such as 1-2-3 etc. When you say: I buy when RSI shows oversold provided that MA-8 is above MA-15 - you use indicators-based setups. See the difference?
Price action is not only about breakouts from previous candle range. A doji-bar within the previous bar's range tells us quite a lot as well. Very often, a dodji in such situation leads to a congestion - a pattern that occurs in terms of price action, but indicators that smooth price movement would fail to pin-point a congestion. However, one could argue that in a whipsaw all MAs are crossed and disordered. That is true. However, looking at price bars I can recognise such whipsaw long before all MAs have detected it. I need only 4 bars for that. Sometime, even less (2 bars only). In terms of MAs you will have to use MA-4 in order to achive such accuracy and speed. Of course, these congestions are just market noise and should be ignored, and MA would help to ignore them. But if it helps to ignore false signals then probably they are not used properly by many traders. What do I mean? MA smoothes price jumps and if the price jump is a false breakout then MA lags behind and the moment it arrives at this point the price could already retrace back. Then you should look at where the price currently is in respect to current MA value and then only decide whether to open a position in the direction of a jump. But that means combining price action with MA. That is what I was talking about.
If you ignore the price action in this scenario then you can use shorter MA instead, but the price could have retraced already in respect to the shorter MA and you wouldn't even be able to notice it. Instead of filtering false signals you just generate a different set of them. Today you earn on MAs tomorrow you loose - who knows.
BB is MA of yet another price derivative. Again you have a lagging indicator of where the price goes or how it behaves in its way. If you combine it with price bars - you can get a consistent sistem. If a candle touches BB but closes below - it looks like a combined price-action-indicator setup. If you say: I will buy when BB turns up and widens - you cannot be profitable then (in my view). I don't know exactly, how you use your BB and MA.
Volume might help some - I have no idea. For me - it is misleading. You open your positions on price not on volume and you get your P/L on price as well. If you think that simebody can be so generous to give you a clue about the future price movements, think why? But again, if you find a way to combine price action with volume that volume could probably be some sort of additional emotion-free filter. I just haven't found any way of using volume or COT.
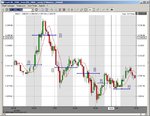
You asked me to post a chart with my understanding of what the price action is? I have prepared one. It uses MA-4 shifted by 2 periods ahead of time. S&P futures (ES) 5 min.
Point 1: green candle that above MA completely then one more which is doji - sounds like a short break before moving further. If I place a stop-order entry above that doji I will be long until I see a candle completely under MA (not just penetrating it with a whick). It happens at point 2
Point 2: a small candle under MA which is preceded by a big red candle - looks like a short break before moving on. We place a stop/loss for long position and stop-order sell entry to go short.
Point 3: We see a doji candle above MA and place stop-and-reverse here. As it is breched we go long again. A red candle under MA happens a little bit later almost at the same level. So we can now close our position with a stop/loss at breakeven when it is breached by a red candle with a long whick later. However, this order was not stop&reverse because there wasn't a significant move in one direction followed by a short break. What we saw instead was a short move down, followed by a significant retracement up with a green candle almost without any whicks and located above MA. Our stop/loss remains in place but we don't place an order to go short until we see a clear signal. Also the price was circling up and down in a congested area.
Point 4: When the red candle with a long whick has finished we can see it as a move out of the congested area followed by a short "sleepover" which is manifested by a long whick - the price went down and the retraced. But it didn't retrace back above MA and therefore we can go short if its low is breached.
Point 5: The first candle above MA appeared here, followed by a red small candle - a short break again. We reverse and go long here. Although in hidsight I can see that the price has already made a substantial move up with a short break in the middle. Now we have the second break and the rally is probably over. Shouldn't go long though. But we could only see it if we were not using MA - it was too late to catch up with the price.
Point 6: Althought we placed a stop/loss here but should probably go short just yet. The price is still within a congestion - a big chance to hava just a spike out of congestion to run stops for brokers and market makers followed by a retracement. Also, price moves up and down are getting sluggish - would probably enter a whipsaw soon. So, we are closed here with a relatively small loss, but overall had a profitable day.
Did you like this idea?
Splitlink said:
What is your definition of "price action"? The ability for a price to break beyond a previous high/low? Or the the total amount of activity within a bar? Or something else?
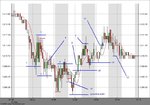
I enclose a chart of CPI, a share that I have been trading. Normally I prefer to trade over days, when I can get into a good run. The hourly chart I use to pick entry points The average and BB is 20 bar.What's the difference between "price action" and a candle where the body is almost the whole of the bar? Nearly all green or red, for example? Maybe this isn´t the best chart to use but it is the only hourly I have saved, at present.
I rarely use indicators, so we agree on that point, but when someone advocates against the use of them, including volume, they quite often say "price action is the best way to read a chart".
Regards Split