TheBramble
Legendary member
- Messages
- 8,394
- Likes
- 1,171
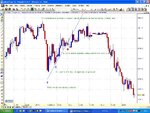
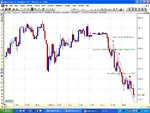
Does anyone else get a feel that for any given timeframe, there is a specific contraction of time along the x-axis which 'seems' more appropriate or more comfortable (sue me) for a non-logarithmic price scale on the Y-axis?
(That alone will probably ensure zero replies)...but to ensure complete silence...
Further...
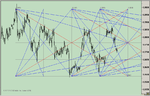
In that 'comfortable' fit of X and Y - axes, does anyone notice how trends are dead easy to pot (i.e nail the end or at least the end of the real momentum phase) by using the 60 degree line connecting 'clearly visible and uninterrupted line-of-sight' lows on an up trend or highs on a down trend?
(That alone will probably ensure zero replies)...but to ensure complete silence...
Further...
In that 'comfortable' fit of X and Y - axes, does anyone notice how trends are dead easy to pot (i.e nail the end or at least the end of the real momentum phase) by using the 60 degree line connecting 'clearly visible and uninterrupted line-of-sight' lows on an up trend or highs on a down trend?