Using Candlestick Charts & Patterns to position trade US Stocks & ETFs

Pollux

Member
Messages
97
Likes
1
Martin Luther King Day 16 Jan 2006

In this thread I'll endeavour to show how I use candlestick patterns as a primary tool to position trade US stocks & ETFs. Hopefully there will be some interesting angles from the trade examples that will be posted here. I use a core basket of stocks, largely major names, that crop up time & again.

As well as equities, ETFs and the Nasdaq E Mini are a focus as well.

Feel free to offer up new names for discussion and analysis.

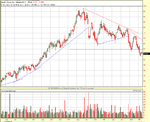
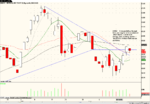
SMH printed a bearish pattern (negative bearish engulfing hourly chart or -BE H) on 12 Jan; Friday's recovery off the 39.20 level follows a new +BE H. So you could say we're on a 'score draw' right now. MLK Day slightly muddies the waters. We'll see where we go early Tuesday 17th. We probably raise stops to near break even due to more general market feel. On the other hand, we'll monitor influential sector stocks such as INTC, TXN closely as we watch which way SMH may break.

Chart : SMH 39.92 12012000 short 39.92
 

Attachments

  • smh_12012000_nbe.pdf
    91.6 KB · Views: 925
SMH weak at open

Widespread weakness from pre release nervousness (IBM, INTC), an investigation into a Japanese unit of YHOO & a downgrade on AMD sends NQ back through the +BE H & through the 1749 level. This is probably going to be a time to keep that stops tight until the current headwinds weaken. The Iran backdrop doesn't help at all. We've seen this type of market before, with rising nervousness off of a low base. No bad thing in our view. Yes, the market will have its period in the sun, but it has to be for the right reasons, and the move has to be built on solid footings off of a sound technical & psychological base.

Re SMH: Intel and AMD soft pre open; liable to remain volatile: stops tightened on half this trading position
 

Attachments

  • smh_17011300.pdf
    216.4 KB · Views: 653
IYT told the tale...

This is a major part of the evidence that argues against a sustained up market....right now. A quite distinct -BE D under our noses. Go up against the transports and the semis at your risk!
Copper, gold, emerging ETFs were saying we're off to the races: transports begged to differ. Treat them like a very smart hedge fund or something...
 

Attachments

  • iyt_17011722.pdf
    211.4 KB · Views: 738
Missing in action: Tokyo & chip sector perma-bulls. Usual reward offered.

Pre open all tech v weak as INTC, YHOO, IBM all fall short on numbers. Tokyo stopped 15 min early: what a peculiar market . Last time that happened in NYC was in '87.

We have pared back exposure to three positions (SNDK, SMH, FDX), all shorts, which is the bare minimum for a reasonable amount of diversity. Thankfully, we caught one of the 'stampede' names, SMH, with a full position, on the short side. This correction should now start to evolve into something more complex than a mini pause before the next run up in all the ususal leaders: EWJ, SMH, GOOG, AAPL, EWZ. In recent months, we'd point out consensus near term thinking has been having a rough time trying to get on the right side of these shifts. It shows, I think, that this is a difficult market phase to analyse with any confidence. Keeping close to the leaders is about the best way we know to stay tuned, and stay (more or less), out of major trouble. This is a volatile world, and equities are one of the most efficient ways to monitor its many moving parts.

Tuesday's intraday note on the transport ETF, IYT, illustrates this point well. This was a major part of the evidence that argued against a multi phase up market, at least right now. A quite distinct -BE D printed right under our noses. Lesson 1.1: Go up against the transports and the semis at your risk! There's a growing feeling around these parts that the Fed has already gone too far, which has been building for a while. Things like transports falling apart bolster that view. One thing we can be sure of: a highly levered consumer with oil at 65+ will be getting the Fed's attention again.

Unlike SMH, we were asleep at the helm on IYT, frankly. A bit too much of an energy play, but nonetheless, honestly! An immaculate -BE D for the textbook. Shake a leg, Pollucster!!

Here's the FDX 'punt' fwiw...
 

Attachments

  • fdx_17011439.pdf
    30.4 KB · Views: 811
Smh 37.76

Here's the view on SMH pre-open, sitting under the 62% retracement level. Likely will take 1/3 out in short order, leaving 2/3 of original piece.
 

Attachments

  • smh_18011423.pdf
    34.3 KB · Views: 748
SMH pounding...

Hello candelabras! (eh?)

Short & sweet this afternoon. SMH is still in play. We kept a 2/5 position...

Why 2/5?...seemed good idea at the time...my obsession with round numbers overruled sound position management and an equal liking for symmetry. Weird. Better call my resident shrink, Mr Strewthmate. He's into all that mind stuff.

As my plate is not full, open to being pinged with your favourite charts (candles only please!), suggestions, or if you'd like a quick nickel's worth on a chart or two.

Have a good one

Pollucster
 

Attachments

  • smh_20011554.pdf
    32.1 KB · Views: 627
Last edited:
SMH: no early sign of a snapback

23/01/2006 14:52 / SMH / Latest notes from Friday & Monday 23rd: +++ 20011553 / 37.75 / bear signs building as we re-enter support zone which held 18 Jan / ++++ 23011431 / 37.51 / close remainder on an H (hourly chart) close above late Friday resistance at 37.68.
 

Attachments

  • smh23011434.pdf
    36.7 KB · Views: 588
Last edited:
Gold & the market

I'm working on improving the timeliness of these notes (trust me...when you look at the chart of GLD and its ilk...chart) - here's our piece from last week on gold...We’re also thinking that Gold will be the next “shoe to drop” (commodity to fall in price). Momentum is waning, negative divergences are developing, and some technical indicators are starting to show some “dead crosses” (when shorter-term indicators cross below longer-term indicators, giving bearish signals....

This system driven comment was closely supported by the fine bearish pattern on the day chart on GLD, NEM etc. NEM probably is the best pattern to study.

Back to real time (plus or minus a bit...) -- we're on the negative tack - still - on NDX - while neutral SPX. Why? the market has given back a lot quickly, so the time for outright bearishness, short term, probably has passed. Having said that, despite pockets of resistance (SMH for one), it feels better to be neutral with short bias than anything else at this juncture, until we get a decent sign of stability and the potential to build a decent base of sorts.
 
Pollux said:
As my plate is not full, open to being pinged with your favourite charts (candles only please!), suggestions, or if you'd like a quick nickel's worth on a chart or two.
Hi Pollux,
You appear to be ploughing a lonely furrow, so I thought I'd take you up on your offer - if it's still open? Any views would be appreciated. Can I request that any future charts include volume please?

Attached is a weekly chart of APOL which is looking a bit sorry for itself. I'll pick up the action - as I see it - from last September. This is when APOL's fortunes turned from bad to worse, evidenced by the huge bear candle plummeting through the blue demand line on equally impressive volume. It just managed to find some support at the earlier low from May. The tiny bull candle that followed on (relatively) low volume looks like the equivalent of running the wrong way down a Pamplona street during the bear run. Ouch! Selling picks up again and although volume too is rising, some of it is the result of buying, as we can see from the candle tails. Support is found at $60 - or just below - and the lower low is marked with a hammer of sorts, but not a really sexy one. The magic of a decade number perhaps? Anyway, support is found here for whatever reason and buying pressure picks up - initially. However, it is not sustained and the candles shrink as price approaches the $72 area, suggesting that buying pressure is waning fast. This marks the most recent lower high and enables a second lower trendline to be drawn; infering that the downward momentum is as strong as ever.

The second candle of December with the large upper shadow suggests a bit of a fight on the part of the bulls, probably the ones who bought in during the Oct/Nov retracement. My guess is that many of their stops were just below the open of that week and, coincidentally, the low of the previous week. Once the price dropped below the open, stops were popping off here, there and everywhere and, for good measure, shorts then entered the fray. December and January are something of a repeat of September and early October. There is temporary respite at the New Year around October's $60 support mark. Then wham! A huge bear candles takes APOL into fresh 2 year lows.

Some support has been achieved the week before last around the $54 mark. However, last week's volume tailed right off and the doji is smaller than a very small small thing. The high of the week is hardly higher than the previous week's and, indeed, the low of October's hammer. Where's the buying pressure? It looks to me that the path of least resistance is still very much south and those brave souls that bought the week before last must spend their nights dreaming about catching falling knives . . .

Tim.
 

Attachments

  • APOL_07.02.06.PNG
    APOL_07.02.06.PNG
    47.7 KB · Views: 5,154
timsk said:
Some support has been achieved the week before last around the $54 mark. However, last week's volume tailed right off and the doji is smaller than a very small small thing. The high of the week is hardly higher than the previous week's and, indeed, the low of October's hammer. Where's the buying pressure? It looks to me that the path of least resistance is still very much south and those brave souls that bought the week before last must spend their nights dreaming about catching falling knives . . .

Tim.

Nice work Tim. Very nice if you've caught some of this decline in APOL. It's a tough name for sure, and it used to be on my focus list in 2004 I think. Strewth & I will add it to our watch list and endeavour to squeeze some juice out of it. For now, unless we're talking a few bucks worth of a bounce, there are not many redeeming features. But this can change, so we'll sharpen our focus on the name...

Market wise, balance has shifted to neutral on NDX now. Here's the QQQ chart.

Regards, Pollux.
 

Attachments

  • qqqq_08021242.pdf
    38.4 KB · Views: 467
APOL -- the daily bullish pattern as MA's crossed was preceded by an upturn in money flow. Friday's breakout was on higher volume. Classic entry now, having missed the intra-day triggers, is a pullback to previous resistance: the recent uptrend is a relatively short one versus the serious technical damage incurred since Dec 05. (pdf)
 

Attachments

  • apol13021402.pdf
    34 KB · Views: 530
Strewth & I are going to put more charts & notes here. When time is short the notes may be a little cryptic or brief, but we'll try to add further commentary as a follow-on.

Some will be purely for observation and hindsight analysis. Others may be a little closer to our actual thinking on a given situation...

The common theme in these chart setups? Easy to see, low to medium risk action points, and importantly the same recurring dozen or so factors that we're continuously looking to line up to find good ideas.

So with no further delay, here's the first one...

7 Feb 09:05 -- VOD
- Break above recent base
- Volume +
- +BE D at prior S

(Strewth may be able to add further detail on this pattern in the next day or so...)
 

Attachments

  • vod17020903.pdf
    217.5 KB · Views: 489
Charts

Here's a couple of things we've been looking at over the last couple days.

On the QQQ yesterday we noted:

"If we see follow through here, we may be on to a sustained effort higher. Fuel is back -- energy, semi, housing, broker -- but all four of these fuel sources are fickle."

And fickle they've proven to be so far today's market. Of note though is Gold, (GLD) which has put up some nice technical patterns in the last few days, offering a potential long position. See charts below.

If you're interested in adding low risk short term trading to your arsenal, we've an informal web conference on the subject next week - details here

http://www.trade2win.com/events/event.php?id=1126
 

Attachments

  • QQQ.png
    QQQ.png
    42.5 KB · Views: 7,433
  • GLD1.png
    GLD1.png
    31.7 KB · Views: 4,331
Apol

Snapshot: Apol Conforming To Classic C/s Rules In This Current Move To The Top Of The Rz Formed By The Falling Window.
 

Attachments

  • APOL2102.pdf
    229.3 KB · Views: 504
Reversal underway?

This jumpy market continues to make any trend setting positions kind of tough. I've attached a bunch of charts that popped up on our radar today. Strewth is pretty hacked off with me for pulling the AMR and indeed ES shorts on a whim. ...as for Perseus, he has re-surfaced and poised to **** his snoop for the nth time. Wicked fellow... (Perseus negative on market since mid week last week...)
 

Attachments

  • polaris_210206_1922.pdf
    325.2 KB · Views: 459
Market mood swings continue; SNDK, MSFT others pop as some call this the break-out...

This is a good example of a hang in there scenario which you just have to be prepared to do with 'heavy swingers' (we're not talking day trader GOOG fare here, just regular high beta, high quality 30-60 dollar stocks that are on all growth buyer's radar at the very least.

SNDK would not be a full position type of name that often for us, especially in this jumpy tape, and especially as we - the proverbial we - are split down the middle vis a vis this market (See prior comment which still applies on the broad market view). So we took a stab based on the pattern which was about as clear as they get (see PDF for a few aspects of the setup that we liked -- there were other elements for sure, but no doubt the +BE D was the key one...). I

It's more than OK to take a stab when a strong pattern pulls you in, in my view. Of course, a table-thumper of a stock pattern confimed to the hour by a recognisable pattern in the indices is what we dream about and are in business for, really.

Trouble is they can be scarce, and then of course they will appear in their dozens. Meanwhile we settle for 'stabs'. Better than a grope in the dark, but just not as good as those beauty setups we all love!

Anyhow, here's the chart for the record...

Good trading, Pollux
 

Attachments

  • sndk27022240.pdf
    222.3 KB · Views: 532
Web seminar

Thanks P

Just a reminder that there's a free web seminar today at 18.30 GMT/ 13.30 EST. We'll review some essential aspects of trading in US equities, ETFs and E-Minis. We'll also review a number of recent trades, analysing the charts and what was occuring in the broader market at the time to show how we select our swing trading entry & exit points. Also If you're a day trader looking to add low risk swing/ position trading to your arsenal, then this might be of interest to you. More details here

To access the seminar use THIS LINK

Please do this in advance of the seminar to prepare yourself as it can take a few minutes to get set up, depending on your internet speed. The room will be 'open' 24/7 so you can test it any time. We are using Paltalk which is a secure web chat facility. If you have not used Paltalk before, you may be asked to download some software & to authenticate that Paltalk is a valid program by your anti virus software. The software requires Internet explorer and does not work with Firefox browers.

All the best

Dave
 
28/2 10:21 -- The broad market had a decent move above key resistance yesterday, with several notable areas standing out.

Big cap tech, including amazingly MSFT (who announced plans for 6 versions of its upcoming operating system, Vista, targeting different categories of users), came to life and gained some traction.

Lowe's, following on from Home Depot's strong report, reported healthy numbers. All what the market wants to see: stable & growing consumer spending orientated to the housing market, embryonic signs of a more consistent trend in IT spending & demand across all colours of the spectrum -- consumer, corporate, public spending, international.

On our radar remain: SNDK, APOL, TLAB, ES & NQ. We removed AAPL, PD, GLD as the short term focus shifted elsewhere. Elsewhere, CSCO hovers under a major level at 20; IJR (S&P Small Cap ETF) broke out then pulled back & printed a minor bear pattern, as did SPY.

Here's the ES chart showing a differrent picture to the headlines on new 4 1/2 year highs etc....
 

Attachments

  • es28021016.pdf
    218.3 KB · Views: 648
Nice call ES - not so good CNBC...

Here's the updated ES chart which did a pretty good job of calling the stiff resistance area, as we discussed earlier.

Note on IJR we have a potential evening star bearish pattern setup, presaged by that clear minor bearish reversal pattern mentioned in the previous post.

We're flat SNDK now as we await further developments.

I'll be touching on these later today in the 'webinar' for those joining us...

Good trading...

P

28/2 15:54
 

Attachments

  • es28021539.pdf
    213.2 KB · Views: 514
Top