Atlantic Trader
Junior member
- Messages
- 13
- Likes
- 0
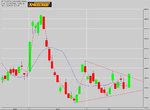
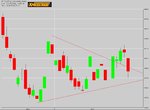
I have been watching this triangle develop in the Dec, cocoa contract . I was expecting it to break to the downside as the triangle is in a downtrend. But low and behold it has moved up through the trend line.
Any opinions out there as to why?
I had one thought that the price action was too close to the apex.
Iam not sure yet as to the volume of the move until after the open tomorrow?
Any ideas or opinions?
Any opinions out there as to why?
I had one thought that the price action was too close to the apex.
Iam not sure yet as to the volume of the move until after the open tomorrow?
Any ideas or opinions?