The law of ledges, congestion, and trading ranges

sulong

Active member
Messages
249
Likes
16
The law of ledges, congestion, and trading ranges.

The purpose of this thread is to look closer at sideways movement as defined by Joe Ross.
You can get the law of charts here.
http://www.trading-naked.com/Articles_and_Reprints.htm
As the usual second half of the day of trading is most often setup with this sort of price movement, there seems to be little discussion about potential breakouts from sideways movement.
Anyway, the 1-2-3 thread is good, so perhaps an extension of that will be of benefit.
http://www.trade2win.com/boards/showthread.php?t=13451&page=1&pp=40

The topic begins on page 6 of the law of charts, through page 12. Page 12 is very interesting as is page 18. and more of the topic from page 39 through page 50.
Ledge is 4 to 10 bars
Congestion is 11 to 20 bars
Trading range is 21 or more bars.

From JR's web site.
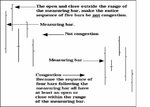
TRADING IN CONGESTION
Sideways price movement may be broken into three distinct and definable areas:
1. Ledges - consisting of no more than 10 price bars
2. Congestions - 11-20 price bars inclusive
3. Trading Ranges - 21 bars or more with a breakout usually occurring on price bars 21-29 inclusive.
Trading Ranges consisting of more than 29 price bars tend to weaken beyond 29 price bars and breakouts beyond 29 price bars will be:
• Relatively strong if the Trading Range has been growing narrower from top to bottom (coiling).
• Relatively weak if the Trading Range has been growing wider from top to bottom (megaphone).
We have written considerable material about breakouts from Ledges, primarily that since by definition, Ledges must occur in trending markets, the breakout is best traded in the direction of the prior trend, once two matching highs and two matching lows have taken place.
The next discussion deals primarily with Congestions and Trading Ranges:
Under the topic of the Law of Charts, we have defined the first correction following the breakout of a Trading Range or Ledge as being a Ross Hook.
 

Attachments

  • JR meas..JPG
    JR meas..JPG
    35.6 KB · Views: 1,218
  • JR trading range.JPG
    JR trading range.JPG
    10.2 KB · Views: 1,064
Some screen shots from earlier today

Edit. the 2 charts at the ends are the consoldation, the one in the middle is the BO.
5m charts with smaller 1m chart on the side
 

Attachments

  • cons 1a.JPG
    cons 1a.JPG
    125.7 KB · Views: 1,020
  • bo.jpg
    bo.jpg
    123.1 KB · Views: 916
  • cons2.jpg
    cons2.jpg
    129.1 KB · Views: 881
Does anyone know how the law of charts deals with the circled area of the second consolidation?
Is the consol. still intact according to the LOC?
 

Attachments

  • ym ad.GIF
    ym ad.GIF
    32.9 KB · Views: 1,127
sulong

not sure - I think I might have regarded the long down candle at the start of your circle as a break out and a ross hook, although it's not clear that the low exceeded the low of the earlier doji. I'd have then been trying for a tte for the next three candles (never triggered) and given up when price moved back into consolidation.

But I guess you'll point out the error of my thinking ;)

cheers

jon
 
Jon,
I really don't know the LOC answer to this. I've got my own way of determining when a congestion is over, but I was investigating if the JR way was the same or similar.
I'm intrigued with JR's bar count method for separating ledge / congestion / trading range.

Everybody, please forgive my use of the word "consolidation" for JR's word "congestion".
 
sulong

i've never been really convinced about the use of a "measuring bar" to identify congestion (although i've tried it for a number of set-ups) because i can't see the supply/demand logic in it although i suppose it's there somewhere.

could be an interesting thread this - a bit surprised there haven't been more takers yet.

good trading

jon
 
barjon said:
sulong

i've never been really convinced about the use of a "measuring bar" to identify congestion (although i've tried it for a number of set-ups) because i can't see the supply/demand logic in it although i suppose it's there somewhere.
jon
A measuring bar is by nature a longish bar, and by the fact that there is no follow through suggest at least a short term exhaustion move.
Therefore the price will consolidate for a time within that (emotionally charged) last price range (measuring bar) until a one sided disagreement of value presents itself.
 
Given what you know about testing, sulong, I assume there's a "supposedly" weaving its way through all of that . . . :)

--Db
 
dbphoenix said:
Given what you know about testing, sulong, I assume there's a "supposedly" weaving its way through all of that . . . :)

--Db

I'm not really sure what you mean here? I must not of expressed myself very well.
Perhaps the focus is on the "measuring bar"? If so, I view that as a preliminary immediate S/R area. Much like a preliminary trend line, just a place to start.
As more price information becomes available, the better the supply/demand dynamics are seen at the preliminary s/r area(measuring bar)

I don't want to get too far off track here, my main interest is the way JR employs his bar count method, and his definition of ledge. congestion and trading range with regard to his open or close of indivisual bars and follow on bars.
 
sulong said:
I'm not really sure what you mean here?

That all of Ross's propositions need testing and verification. I acknowledge that he has some good ideas, though much of it comes from Dunnigan. However, there are elements left out of these propositions which may have a significant effect on the results.

For example, the "bar count", on the face of it, makes no sense, since the bar might be anything from a one-second bar to a one-week bar (or other). Therefore, the question becomes not so much the number of bars, but of time and expectations. For example, one can't expect the same results from a 20-1m-bar consolidation (or whatever) as he might from 20-1w-bars. There is also the question of what one might expect from a consolidation at S/R of some sort, such as the PDH, as opposed to one which takes place at some seemingly random level.

You know, for example, about energy collection and dispersal and how all of that relates to volume and time. That is likely to be as important, if not more so, than counting bars.

Or maybe not. Which is the point of testing all these propositions.

--Db
 
Ok now I see what you mean.
One of the problems of testing JR stuff is that in my book he uses the term "trend" rather loosely, or at least some what different than I do.
But there is much in the law of charts that I've seen that is very similar to what I have been writing down as my own testing parameters. For instance, JR says "measuring bar" and sulong says "bozo bar", but the gest of it is the same.

As far as the build up of energy, and what to expect from it, that, I think, has to do with how one wants to define "trend". For instance is a series of consecutive bars making higher highs and higher lows good enough for a trend? Or does a "trend" need to have a series of reaction bars within it's body?
One definition will need more stored up energy to create than the other one will.

Hopefully those who are using the JR 1-2-3 reversal / continuation,R-hooks and TTE will chime in, as Joe himself says that recognising the onset of congestion / trading range is extremely important.
 
Which is why these roads tend to bend back to defining terms, defining the setup, then testing the setup. A soft definition of trend is fine, but leads to all sorts of blind alleys. For me, unless trend is defined precisely, then there's little point to progressing to the rest of it.

However, I've criticized others for hijacking threads and I don't want to commit the same offense, inadvertent or otherwise. If my posts here are pointing people in the wrong direction or are in any way off-topic, feel free to ask that they be deleted.

PS: With all that in mind, you may want to review what you have on springboards.

--Db
 
Note.
This is a 5m chart and 6:30 represents my local time for the open of “regular trading hours”( 2 marked up charts and 1 naked chart)
Comments relating to the “law of charts” and my interpretation as presented are welcome.

Thursday.
6:30 open – price dropped down to test the lows of the early open. The first 5 m bar was long and bozo like,a potential measuring bar.
Zone A.
The first 2 bars following the pmb(potential measuring bar) created 2 equal lows which count as 1 (double S page 35) of a potential RH. The following bar is an inside bar, which is the first opp. for a tte but only 3 to 4 points potential profit. The following bar is the fourth in the series but counted as #3, makes a double R,and also presents a better price for a tte.( about 6 points).
The following bar did a couple of things. First, the tte was not triggered and nullified the whole tte sequence. Second it made a local higher high and a potential # 2 of a 1-2-3. third it launched the whole sequence into a ledge/congestion/trading range formation.
Ether way, the price action needs to resolve it self before any action can be taken.
Zone B.
price broke out of a 8 bar congestion area, and then presented a potential RH, followed by a 2 bar tte setup, which gave about 5 pts from place of entry to RH point, and a stop loss of about 11 points. 6 bars later the RH as well as the tte entry was tested and violated.

Zone C
The bar that followed the last bar of zone b set up a potential RH or a #1 of a 1-2-3.
And then a double local R and S,count as 1 bar in the sequence of a tte. By the close of the 5th bar no tte entry has been triggered, so we wait for price to resolve itself.

Price then makes a local high and a potential #2 of a 1-2-3. The 6th bar that followed the potential #2 confirmed a higher low ( more evidence of a trend reversal) and a potential #3 of a 1-2-3.
Price then congested for 10 bars in the #2 and potential#3 range, the 11th bar broke out and confirmed the #3 point.

Zone D
The bar that followed the breakout bar set up a RH, price set up 1 opportunity for a tte entry, with a first potential target of about 4 points, and a stop loss of about 9 pts.
There was 2 RH's and 2 tte's in the D zone of price.

Zone E.
The high of zone E represents ether a new RH or a potential #1 of a 1-2-3.
4 bars passed with no RH tte being triggered, so we wait for price to resolve itself
The 6th bar in this series created a potential #2 point and #3 point with the same bar.
The 7th bar created both a potential RH and a congestion, so once again we wait for price to resolve itself.
Price congested for 9 bars before breaking out to the down side, creating a potential RH in zone F.

Zone F.
Following the potential RH price retreated only about 2 points before making a lower low and a new RH. The following 2 bars presented a tte with about 9 pts for a first potential target and about 6 pts stop loss.
Price continued down for 2 bars making another potential RH or Potential #1.
The following 3 bars presented another tte while it tested and violated the entry price of the first tte of this series.
The potential first target of this tte was about 20 pts with a stop loss of about 13 pts.
2 bars later price was unable to hold a lower low, and then tested the last tte before failing to make a lower low.

Summary
I count 7 RH's during the day with 4 of them being continuations.
2,1-2-3 patterns and 3 congestion patterns.(4 counting the last part of the day).

Over all a range bound market on this day.
 

Attachments

  • thu eval.GIF
    thu eval.GIF
    33.4 KB · Views: 519
  • ym th fri.GIF
    ym th fri.GIF
    31.6 KB · Views: 423
  • thu eval a.GIF
    thu eval a.GIF
    32.5 KB · Views: 459
Ledges

Sulong ,

If you haven't already noticed $XMI may be a good example of a ledge.

erie
 

Attachments

  • $XMI.gif
    $XMI.gif
    48.6 KB · Views: 549
Top