Reversal patterns

Verno

Member
Messages
77
Likes
3
Hi All,

I guess this will relate to anyone but what do people find effective as reversal patterns. I find myself time and again going against the trend and getting stopped out. Then when I look at the chart again I see there was no real confirmation of this reversal.

I will suggest some to start with if we assume the end of a downtrend.

- Market makes a higher high and closes above the high of the previous bar
- Break of trendline.

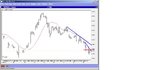
I attach a current GBPUSD chart where I think we are at the end of a down move but am waiting for some sort of confirmation.

On the chart I am looking for a break and close above the redline which will also coincide with a break of the first downtrend line. I am then looking for confirmation with a break of the 2nd trendline.

Other thoughts appreciated
Verno
 

Attachments

  • cable2.JPG
    cable2.JPG
    73 KB · Views: 469
Try Victor Sperandeo's work on reversals. Trader Vic 1 and 2. The best advice I could give.
 
Can you point me in any directions to find this, ie on T2W or generally on the web or a book?

Thanks
 
Much obliged all. I had actually seen that 1-2-3 forum before Frugi and was going to mention it. Or at least I saw one that talked about Ross hooks as well. I will take a look.
 
I took this from T2W traderpedia.i believe its very true.

"The trouble with 1-2-3 breakouts is that a large number of traders know of them and may all be trying to get in at the same point. Meanwhile professional traders may look to fade the breakout, i.e going the opposite way as all the smaller traders' buy or sell stop entries are triggered."

This is absolutely true.The trouble with so much of the old set ups is every trader thats been around a while knows them.They know what the rules are and so do the market makers.My advice is to take the set up and put new rules to it that take advantage of how the crowd want to play it.

I worked with a brilliant US trader once who mused that his best set up had changed.All he did was sit back and change his rules and the result was astonishing.To my mind thats what needs to be done with 1-2-3's
 
Knowing when a trend has ended is a ‘Million $’ answer to a question that unfortunately Reversal Formations don’t provide a clear answer to since such formations don’t repeat consistently.

Waves/Trends completions/reversals may have an RF — or not. RFs may make a HH/LL in the form of a \/\/ or /\/\. Such formations may be brief or extended particularly if a significant economic report is due for release. Waves/Trends can reverse 'immediately' as an \/ or /\ continuing in the new direction without a ‘retest’ of the previous L/H. Indicators such as a Stochastic or Relative Momentum may be useful in terms of the timeframe being traded.

Personally I work with Elliott Wave theory, MetaStock’s Standard Error Channel, the Fibonacci Price Levels tool and Bar Counts for Time Targets. EW is quite subjective and not everyone finds it useful; within the theory but discounted by the authors of ‘Elliott Wave Principle : Key to Market Behavior’ – Frost and Prechter is the ‘AB’ formation, essentially an RF that Elliott obviously noted since he named the formation, but perhaps couldn’t accommodate in his ‘principle’ within his strict 12345ABC ideas. This AB formation does however occur in all timeframes at the end/beginning between the smallest Waves — but not on every occasion.

The SEC is for me the simplest method of applying trendlines and easily adjusted as the Price Movement progresses; it can be copied, pasted on top of the original and widened or narrowed parallel to the original SEC to accommodate Extensions and the EW formation of a whole Wave.

Fibos are the simplest and most accurate Price Target Projection method I know of, applied based on an understanding of EW. Used to target Corrections – price down in up trends, Retracements – price up in down trends, they also are very accurate.

While some charting programs such as Dynamic Trader provide Fibo Time tools, I prefer counting individually Price Bars – Bar Counts. Depending on the individual instrument being traded, the BC will count to the Fibonacci Ratio number series – 1 3 5 8 13 21 34 55 etc, or, the Lucas Fibonacci Ratio number series – 1 4 7 11 (14) 18 (22) 28/29 (36) 46/47 etc. One can combine the use of both a Fibo Time Tool and BC.

The longer the timeframe being analyzed the more accurate Price/Time Targets will be, so one should work with all timeframes and transpose some info of the longer timeframe P/T Targets to shorter timeframe charts.

Most of the above can be seen applied to charts at:
http://www.trade2win.com/boards/showthread.php?t=14565&page=1&pp=10
and for BC info: http://www.trade2win.com/boards/showthread.php?t=14852

Obtaining a ‘confirmation’ is not easy nor guaranteed. The combination of the above tools provides targets that will sometimes be easily accurate and correct, whereas on other occasions the Price will spike for instance and either hit a StopLoss or confuse one’s analysis of what the Price is doing, particularly on shorter timeframes.

Generally the Price will ‘fall out of’ or ‘cross out of’ a SEC particularly after hitting a significant Fibo level indicating a Trend/Wave change – no gurantees tho.
 
Thanks Tdr, I will look at those links. I am using EW to forecast and I think the general lesson is one signal is never enough no matter what you are doing. The more things that point to a reversal, the more likely.

Thanks
 
Reversal patterns repeat very consistently....however, the reason most traders think that they don't is that they do not have sufficient understanding to differentiate between a "genuine" reversal pattern, and a false one
 
Top