isatrader
Senior member
- Messages
- 2,965
- Likes
- 136
I started this thread for a place for people to discuss Stan Weinstein's method of stage analysis, as I read his book "Secrets for Profiting in Bull and Bear Markets" from 1988 in late 2010 and was very impressed with his four stage breakout method. For those that haven't read the book and are medium to long term position traders, then I recommend that you do, but there's a free article in the T2W archives from 2006 that's a good basic starting point. Here's the link: Articles - Stage Analysis - finding the 'breakout' shares | Trade2Win.
The thread itself has also now developed into a huge free resource, and has links to multiple interviews that Stan Weinstein has done, and has hundreds of examples of the different stages. The discussion has been in-depth at times and has covered a number of the grey areas from the book as well as focusing in detail on all aspects from the book.
I'm interested to see how other people apply his methods and hope for a serious discussion of what's going on the markets and individual stocks using his stage analysis method.
Below is a number of quick links to some of the most useful content in thread, which I will update as the thread develops, so that the best quality information is easily accessible for everyone.
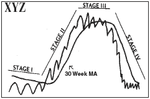
Definitions of the Stages and Sub-stages
Stage 1A Start of a base. Needs much more time.
Stage 1 Basing Phase. May begin accumulation.
Stage 1B Late in base-building phase. Watch for breakout.
Stage 2A Early in uptrend stage. Ideal time to buy aggressively.
Stage 2 Advancing Stage.
Stage 2B Getting late in uptrend.
Stage 3A Looks as if a top is starting to form. Be sure to protect holdings with a close stop.
Stage 3 The Top Area. Start to reduce positions.
Stage 3B Has become increasingly toppy. Use rallies for at least partial selling.
Stage 4A Stock has entered Downtrend Stage. Close out remaining positions.
Stage 4 The Declining Stage. Avoid on the long side.
Stage 4B Late in downtrend. Much too soon to consider buying.
Stage 4B- Although not yet “officially” in Stage 1A, stock has now seen its low for the cycle.
Additional ratings
(A) Early in that Stage.
(B) Late in that Stage.
(+) Outstanding pattern in that Stage.
(–) Unexciting pattern in that Stage.

Examples of the Stages
Over the course of doing this thread there have been multiple examples of the all the stages posted and they can be seen on every page if you take the time to go through the entire thread. However, to view the specific examples created using the Global Trend Alert (GTA) newsletters that Weinstein's firm does for institutional investors. Go to the following pages:
Stage examples from the March 2005 GTA
https://www.trade2win.com/threads/stan-weinsteins-stage-analysis.134944/post-1698054
Stage examples from the March 2012 GTA
https://www.trade2win.com/threads/stan-weinsteins-stage-analysis.134944/post-1804190
Courses:
Udemy – Video Training Course
Learn Stock Trading & Investing Techniques – Stage Analysis
Beginners Guide to Trading Stocks With the Stage Analysis Method – Made Famous in Stan Weinstein’s Classic Book
Stage Analysis Study Guide - Questions and Answers
The purpose of the Study Guide is to help people learn to identify the Stages and to emphasize the importance of a full analysis taking into account the various technical attributes that we look to for guidance in determining the Stages i.e. price action in relation to the 10 and 30 week moving averages, volume, relative performance versus the market and the sector, support and resistance zones etc. Here's the link: https://stageanalysis.net/forum/showthread.php?tid=47
Stage Analysis Breakout Quality Checklist
The checklist is a step by step guide to the technical attributes that you should be looking for when trying to identify a Stage 2A breakout with A+ potential. Here's the link: https://stageanalysis.net/forum/showthread.php?tid=54
Interviews
Audio interviews with Stan Weinstein
Stan Weinstein | FINANCIAL SENSE
Video Interview from the day of the 1987 Stock Market crash
Black Monday - Part 2 - Nightly Business Report Oct.19, 1987 - YouTube
Reading
Global Trend Alert example - March 2005
https://www.trade2win.com/threads/stan-weinsteins-stage-analysis.134944/post-1675626
Extract from Stan Weinstein's interview in the "Technically Speaking" book
https://www.trade2win.com/threads/stan-weinsteins-stage-analysis.134944/post-2037672
Stage Analysis Forum
The forum is the place for people who trade or invest in stocks using Stan Weinstein's method of Stage Analysis and has daily watchlists for UK and US stocks, market breadth and multiple stage analysis examples, learning tools and much more. Here's the link: https://stageanalysis.net
Videos
Stage Analysis Videos
There's a Stage Analysis youtube channel with video of the US and Canadian watchlists at youtube.com/channel/UCKzgts1fFoDla4ozJSn1eZQ/
Frequently Asked Questions
FAQ: How to create the Mansfield Relative Strength Indicator:
https://www.trade2win.com/threads/stan-weinsteins-stage-analysis.134944/post-2137398
Beginners Questions
Here's the link: https://stageanalysis.net/forum/showthread.php?tid=11
To be updated.....Chart software; chart set up; 30 week simple moving average or weighted moving average - as on the Mansfield charts in the book; entry points; sub stages; trader or investor approach; stock scanners, importance of volume, sector analysis, using the method with products other than stocks; weight of evidence approach, momentum index, advance decline, new high new low, head and shoulders patterns in Stage 1 and Stage 3; swing target method; drawing trendlines; theory of contrary opinion; forest to the trees approach; ....I will write this section properly with links to the appropriate posts when I have some free time.
Miscellaneous
Buying Reference - https://www.trade2win.com/threads/stan-weinsteins-stage-analysis.134944/post-1692514
Point and Figure Charts - Free resources to help learn P&F charting
Point & Figure Charting - ChartSchool
Dorsey PnF University
ISA's Charts
Precious Metals
(GC) Gold (13 Dec 2012 - Stage 1) - http://www.trade2win.com/boards/tec...weinsteins-stage-analysis-86.html#post2033926
(SI) Silver (22 Dec 2012 - Stage 4 continuation within major Stage 1 range) - http://www.trade2win.com/boards/tec...weinsteins-stage-analysis-91.html#post2040102
(PA) Palladium (21 Jan 2013 - Stage 2A) - http://www.trade2win.com/boards/tec...einsteins-stage-analysis-101.html#post2057256
Commodities
(CCI) Continuous Commodities Index (21 Jan 2013 - Stage 1) - http://www.trade2win.com/boards/tec...einsteins-stage-analysis-101.html#post2057492
US Treasuries
Latest stage analysis
US 30 Year Treasuries (8 Apr 2013 - Stage 1A) - http://www.trade2win.com/boards/tec...einsteins-stage-analysis-119.html#post2109046
Archive
US 30 Year Treasuries (22 Nov 2011 - Stage 2B) - http://www.trade2win.com/boards/tec...-weinsteins-stage-analysis-5.html#post1727942
US 30 Year Treasuries (16 Sep 2012 - Stage 3A) - http://www.trade2win.com/boards/tec...weinsteins-stage-analysis-67.html#post1967674
US 10 Year Treasuries (16 Sep 2012 - Stage 3)- http://www.trade2win.com/boards/tec...weinsteins-stage-analysis-67.html#post1967674
US 30 Year Treasuries (1 Feb 2013 - Stage 4) - http://www.trade2win.com/boards/tec...einsteins-stage-analysis-107.html#post2066920
Stocks and ETFs
Apple (AAPL) - http://www.trade2win.com/boards/tec...weinsteins-stage-analysis-83.html#post2030646
AIG (AIG) - http://www.trade2win.com/boards/tec...weinsteins-stage-analysis-68.html#post1969468
Reynolds American Inc (RAI) (26 Nov 2011 - Stage 2 Continuation) - http://www.trade2win.com/boards/tec...-weinsteins-stage-analysis-6.html#post1730724
Indexes
Archive
S&P 500 (6 Nov 2011 - Stage 1A) - http://www.trade2win.com/boards/tec...-weinsteins-stage-analysis-5.html#post1716128
Forex
EURGBP (26 Nov 2011 - Stage 4A) - http://www.trade2win.com/boards/tec...-weinsteins-stage-analysis-6.html#post1730478
I hope you enjoy the thread and please participate if you are using Stan Weinstein's method.
The thread itself has also now developed into a huge free resource, and has links to multiple interviews that Stan Weinstein has done, and has hundreds of examples of the different stages. The discussion has been in-depth at times and has covered a number of the grey areas from the book as well as focusing in detail on all aspects from the book.
I'm interested to see how other people apply his methods and hope for a serious discussion of what's going on the markets and individual stocks using his stage analysis method.
Below is a number of quick links to some of the most useful content in thread, which I will update as the thread develops, so that the best quality information is easily accessible for everyone.
Definitions of the Stages and Sub-stages
Stage 1A Start of a base. Needs much more time.
Stage 1 Basing Phase. May begin accumulation.
Stage 1B Late in base-building phase. Watch for breakout.
Stage 2A Early in uptrend stage. Ideal time to buy aggressively.
Stage 2 Advancing Stage.
Stage 2B Getting late in uptrend.
Stage 3A Looks as if a top is starting to form. Be sure to protect holdings with a close stop.
Stage 3 The Top Area. Start to reduce positions.
Stage 3B Has become increasingly toppy. Use rallies for at least partial selling.
Stage 4A Stock has entered Downtrend Stage. Close out remaining positions.
Stage 4 The Declining Stage. Avoid on the long side.
Stage 4B Late in downtrend. Much too soon to consider buying.
Stage 4B- Although not yet “officially” in Stage 1A, stock has now seen its low for the cycle.
Additional ratings
(A) Early in that Stage.
(B) Late in that Stage.
(+) Outstanding pattern in that Stage.
(–) Unexciting pattern in that Stage.
Examples of the Stages
Over the course of doing this thread there have been multiple examples of the all the stages posted and they can be seen on every page if you take the time to go through the entire thread. However, to view the specific examples created using the Global Trend Alert (GTA) newsletters that Weinstein's firm does for institutional investors. Go to the following pages:
Stage examples from the March 2005 GTA
https://www.trade2win.com/threads/stan-weinsteins-stage-analysis.134944/post-1698054
Stage examples from the March 2012 GTA
https://www.trade2win.com/threads/stan-weinsteins-stage-analysis.134944/post-1804190
Courses:
Udemy – Video Training Course
Learn Stock Trading & Investing Techniques – Stage Analysis
Beginners Guide to Trading Stocks With the Stage Analysis Method – Made Famous in Stan Weinstein’s Classic Book
Stage Analysis Study Guide - Questions and Answers
The purpose of the Study Guide is to help people learn to identify the Stages and to emphasize the importance of a full analysis taking into account the various technical attributes that we look to for guidance in determining the Stages i.e. price action in relation to the 10 and 30 week moving averages, volume, relative performance versus the market and the sector, support and resistance zones etc. Here's the link: https://stageanalysis.net/forum/showthread.php?tid=47
Stage Analysis Breakout Quality Checklist
The checklist is a step by step guide to the technical attributes that you should be looking for when trying to identify a Stage 2A breakout with A+ potential. Here's the link: https://stageanalysis.net/forum/showthread.php?tid=54
Interviews
Audio interviews with Stan Weinstein
Stan Weinstein | FINANCIAL SENSE
Video Interview from the day of the 1987 Stock Market crash
Black Monday - Part 2 - Nightly Business Report Oct.19, 1987 - YouTube
Reading
Global Trend Alert example - March 2005
https://www.trade2win.com/threads/stan-weinsteins-stage-analysis.134944/post-1675626
Extract from Stan Weinstein's interview in the "Technically Speaking" book
https://www.trade2win.com/threads/stan-weinsteins-stage-analysis.134944/post-2037672
Stage Analysis Forum
The forum is the place for people who trade or invest in stocks using Stan Weinstein's method of Stage Analysis and has daily watchlists for UK and US stocks, market breadth and multiple stage analysis examples, learning tools and much more. Here's the link: https://stageanalysis.net
Videos
Stage Analysis Videos
There's a Stage Analysis youtube channel with video of the US and Canadian watchlists at youtube.com/channel/UCKzgts1fFoDla4ozJSn1eZQ/
Frequently Asked Questions
FAQ: How to create the Mansfield Relative Strength Indicator:
https://www.trade2win.com/threads/stan-weinsteins-stage-analysis.134944/post-2137398
Beginners Questions
Here's the link: https://stageanalysis.net/forum/showthread.php?tid=11
To be updated.....Chart software; chart set up; 30 week simple moving average or weighted moving average - as on the Mansfield charts in the book; entry points; sub stages; trader or investor approach; stock scanners, importance of volume, sector analysis, using the method with products other than stocks; weight of evidence approach, momentum index, advance decline, new high new low, head and shoulders patterns in Stage 1 and Stage 3; swing target method; drawing trendlines; theory of contrary opinion; forest to the trees approach; ....I will write this section properly with links to the appropriate posts when I have some free time.
Miscellaneous
Buying Reference - https://www.trade2win.com/threads/stan-weinsteins-stage-analysis.134944/post-1692514
Point and Figure Charts - Free resources to help learn P&F charting
Point & Figure Charting - ChartSchool
Dorsey PnF University
ISA's Charts
Precious Metals
(GC) Gold (13 Dec 2012 - Stage 1) - http://www.trade2win.com/boards/tec...weinsteins-stage-analysis-86.html#post2033926
(SI) Silver (22 Dec 2012 - Stage 4 continuation within major Stage 1 range) - http://www.trade2win.com/boards/tec...weinsteins-stage-analysis-91.html#post2040102
(PA) Palladium (21 Jan 2013 - Stage 2A) - http://www.trade2win.com/boards/tec...einsteins-stage-analysis-101.html#post2057256
Commodities
(CCI) Continuous Commodities Index (21 Jan 2013 - Stage 1) - http://www.trade2win.com/boards/tec...einsteins-stage-analysis-101.html#post2057492
US Treasuries
Latest stage analysis
US 30 Year Treasuries (8 Apr 2013 - Stage 1A) - http://www.trade2win.com/boards/tec...einsteins-stage-analysis-119.html#post2109046
Archive
US 30 Year Treasuries (22 Nov 2011 - Stage 2B) - http://www.trade2win.com/boards/tec...-weinsteins-stage-analysis-5.html#post1727942
US 30 Year Treasuries (16 Sep 2012 - Stage 3A) - http://www.trade2win.com/boards/tec...weinsteins-stage-analysis-67.html#post1967674
US 10 Year Treasuries (16 Sep 2012 - Stage 3)- http://www.trade2win.com/boards/tec...weinsteins-stage-analysis-67.html#post1967674
US 30 Year Treasuries (1 Feb 2013 - Stage 4) - http://www.trade2win.com/boards/tec...einsteins-stage-analysis-107.html#post2066920
Stocks and ETFs
Apple (AAPL) - http://www.trade2win.com/boards/tec...weinsteins-stage-analysis-83.html#post2030646
AIG (AIG) - http://www.trade2win.com/boards/tec...weinsteins-stage-analysis-68.html#post1969468
Reynolds American Inc (RAI) (26 Nov 2011 - Stage 2 Continuation) - http://www.trade2win.com/boards/tec...-weinsteins-stage-analysis-6.html#post1730724
Indexes
Archive
S&P 500 (6 Nov 2011 - Stage 1A) - http://www.trade2win.com/boards/tec...-weinsteins-stage-analysis-5.html#post1716128
Forex
EURGBP (26 Nov 2011 - Stage 4A) - http://www.trade2win.com/boards/tec...-weinsteins-stage-analysis-6.html#post1730478
I hope you enjoy the thread and please participate if you are using Stan Weinstein's method.
Last edited: