mb325
Well-known member
- Messages
- 473
- Likes
- 87
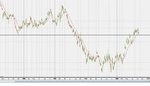
Chart 1: Goes back 5 years and shows the 200p level being tested several times from above and below. Also shows the recent tests of this level during the Summer where it acted as resistance again.
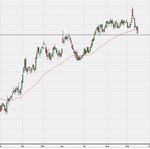
Chart 2: Last 6 months or so. Goes into more detail and you can see the test in June, followed by the breakout and subsequent retest confirming support in July. Today price came back down to this level making a low of 200.2
One to watch in the next few days maybe!?
Chart 2: Last 6 months or so. Goes into more detail and you can see the test in June, followed by the breakout and subsequent retest confirming support in July. Today price came back down to this level making a low of 200.2
One to watch in the next few days maybe!?