US Stocks( Elliott Wave Formations )

marketwavez

Junior member
Messages
27
Likes
0

Here is a thread that is being set up as an atempt to discuss US STOCKS
and possible Elliott Wave-counts---------------------


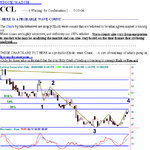
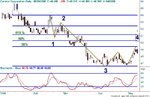
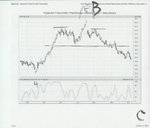
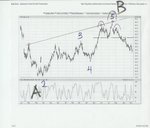
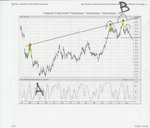
INTEL .... Ticker ( INTC )

.................................................. .................................................. ..

LET'S see .....What do we have here ....

This is one that kinda makes the STOCK World go- round ...


Have had this one on the radar since mid August 05

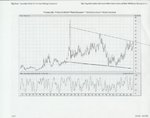
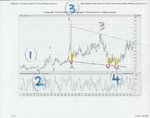
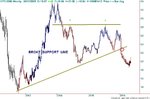
What a stench this could cause world wide , if only the tech sector was to understand these implications .... a double top has formaed in the longer term charts ... Oh No ! ... Not just any old Double Top we also have a retracement of 618 % for those who watch and understand Fibonacci Retracements ....

Well , I leave the Daily charts posted below for you to go figure ? ..............

Please don't go out and buy or sell this stock because you saw this post ......
Utilize your own trading strategy ,,,, I am just trying to post what I see going on.... That's it ... I am not advising anything .... These are not recomendations ....

-------------------------------------------------------------------------------------------------------------------------

What makes a market place is all of our diffrences of opinions .
------- - - - - - - - - - - - - - - - - - - - - - - - - - - - - - - - - - - - - -

It is far more difficult to Exit a trade than to Enter a trade .... I am sure that you have heard that said before ,,,

THIS IS WHY ,

When making trade it just as important to have an idea where you want to exit as it is to place a stop to protect yourself from a move against you .
( THIS IS A PEARL OF WISDOM )


THERE IS NO HOLY GRAIL ///// I KNOW THAT YOU KNOW THIS ....


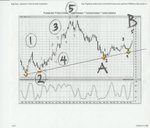
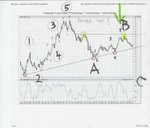
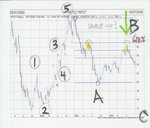
THATS WHY I TRADE ELLIOT WAVES , because its giving you a probability of where to look for a turn in a given market .....
The smaller the risk in relation to the price objective , the better chance of success in long haul .... (This is called Risk to Reward )

It’s just the way that is ...

---------------------------------------------------------------------------------------------------------------------------------
TRADE AT YOUR OWN RISK… The purpose of these charts is to point out significant highs and lows based on Fibonacci Retracement lines and Elliott Waves which are highly subjective . This information is for educational purposes and should not be considered trading recommendations . All trading decisions are your own sole responsibility …
 

Attachments

  • A.-1-ACBC-PG554.jpg
    A.-1-ACBC-PG554.jpg
    71 KB · Views: 5,330
  • A.-1-ACBC-PG555.jpg
    A.-1-ACBC-PG555.jpg
    59.7 KB · Views: 754
  • A.-1-ACBC-PG556.jpg
    A.-1-ACBC-PG556.jpg
    67.7 KB · Views: 1,233
  • A.-1-ACBC-PG559.jpg
    A.-1-ACBC-PG559.jpg
    47.7 KB · Views: 586
  • A.-1-ACBC-PG558.jpg
    A.-1-ACBC-PG558.jpg
    54.2 KB · Views: 598
  • A.-1-ACBC-PG557.jpg
    A.-1-ACBC-PG557.jpg
    53.2 KB · Views: 611
Last edited:
ah Eliott.

can one have an alternative view or would it upset ?

given the size of your wave 1, I would have to call the high only 3 and not 5.
(I would expect wave 4 to last longer than wave 2 and also to be a very clear abc)

and so it follows that the resulting fall is 4 and is to be an abc and may or may not be complete.

I know 4 breaks 1, but that rule is broken more often than you may think.
And Eliott was only intended for Indices.

attachment.php
 
Last edited:
Nem.......

NEM .....

--------------------------------------------------------------------
TALK about right time .... for chart formationns

TALK ABOUT BUILDING A BASE .....
CAN ANYONE AGREE WITH THIS MASSIVE FLAG POLE ?

there is a massive flag pole that appears to be building in this one ...

--------------------------------------------------------------------------------------------------
TRADE AT YOUR OWN RISK… The purpose of these charts is to point out significant highs and lows based on Fibonacci Retracement lines and Elliott Waves which are highly subjective . This information is for educational purposes and should not be considered trading recommendations . All trading decisions are your own sole responsibility …
 

Attachments

  • A.-1-ACBC-PG552.jpg
    A.-1-ACBC-PG552.jpg
    68.8 KB · Views: 510
  • A.-1-ACBC-PG553.jpg
    A.-1-ACBC-PG553.jpg
    72.5 KB · Views: 537
Last edited:
from marketwavez

Hi there double six

I see you speatk the Elliott language .....

Thats good to know ..... I woiuld like to anwswer the question you just posted ..

I am new to this forum as you can tell this is only my 3rd or 4 th post ..

Need your help on something ..... You just took one of the charts I uploaded and made it larger when you re-posted it .. I need to learn how to post my charts that same size ... I have gone back in to try to edit it but I am having a problem with the chart qualuity and size , basically I dont want to post these peanut size charts., my average chart sicze afer scanning is 760 kb ....x 800kb ....

I have alternative counts on Intel that i acan share with you ...... just need to learn this one thing ....Thanx much ....
 
Need your help on something ..... You just took one of the charts I uploaded and made it larger when you re-posted it .. I need to learn how to post my charts that same size ... I have gone back in to try to edit it but I am having a problem with the chart qualuity and size , basically I dont want to post these peanut size charts., my average chart sicze afer scanning is 760 kb ....x 800kb ..

Marketwavez,

When you upload a chart as an attachment as you did in post #1, a small thumbnail is automatically created. If you click on the thumbnail you will be able to see the chart at its original size. This is the preferred method of attaching charts as it takes up less room on the main thread.

In post #3 DoubleSix has linked to one of your charts using the
tags but you should only do this when you are unable to upload a chart as above, perhaps when linking to an image elsewhere on the web.
 
Intel

The stock has corrected from the abandoned baby in July at 28.76. I count 28.76 as 1 intermediate degree. The pullback to todays (10-12-05) low at 22.79 could complete a 3-3-5. Todays hammer could be a v bottom to signal the end of the correction. I notice a positive divergence on the MACD in Sept. and Oct. The stock broke out of the bottom Bollinger band (13, 2) which could allow for a reversal. Really the wave personality could revert back to the impulse on account of earnings reports pouring forth in the next month. This looks like a sweet little set-up to me.
 
A trade setup for tommorow

--------------------------------------------------
STOCK WATCH……….
CCL ------ ( Waiting for Confirmation )…..-5-10-06

- HERE IS A PROBABLE ELLIOTT WAVE-COUNT ----------------------------------------------------------------------
 

Attachments

  • Stock- Watch-CCL-Pg-1.PNG
    Stock- Watch-CCL-Pg-1.PNG
    59.2 KB · Views: 502
  • Stock- Watch-CCL-Pg-1.JPG
    Stock- Watch-CCL-Pg-1.JPG
    88.5 KB · Views: 585
Last edited:
Just as expained above

Intel has now declined from the $ 27.00 price range ......

You saw it here - ELLIOTT WAVES AT WORK ..............
-----------------------------------------------------------------------------
 

Attachments

  • Stock- Watch-INTC-Pg-1.JPG
    Stock- Watch-INTC-Pg-1.JPG
    63.8 KB · Views: 555
Last edited:
Top