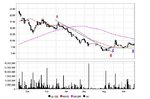
The price touches its lowest point in Aug. Since then, the old trendline AB does not work any more. A new buttom line CD can be drawn.
MA50 gives a upward trends and in recent two month the price hardly drop through the MA50 line.
Yesterday's price is 8.5 and today is 11.5. It is seems that the price have a difficulty to break the 12p line. But, quite lot of investors start to buy in as they think the price is low. The general trends is upward and can break 12p even up to 12.5 or 13. There may be a drop in next week or in next two weeks, however the price won't drop under 8 and a new rise coming up.
In next two or three weeks a rise from around 10 to around 12 is possible.
Attachments
Last edited: