FTSE 100 Index Pivot Days

hwsteele

Experienced member
Messages
1,227
Likes
182
At this point I don't trade the FTSE 100 index but I am thinking of doing so in the future.
As such I decided to start this thread and log my forecasts for this market much the same way I do for the SPX.

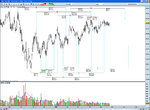
The first pivot date calculated from May 7TH and points to May 18TH, Today.
The 21St also shows to be a pivot day.
 
interesting HW. i'll lurk about here. i'm interested in major reversals, as i sometimes buy UK equities.
 
Very interesting ... im subscribed

Nice to have you(y)
Lets hope it's all good!:cheesy:
The 18th did move the market up but then again that call came a little late so...
The low on May 14th points to Monday, May the 25th.
I do believe that is a holiday over there so look for the 26th.
 
Hi HW,

What method are you using to calculate the pivots?

There is a method I have read about, which is in essence the use of fibs on time. In the example I've attached (BG Group), I am using this formula: 1 x 1.618, to project pivot days in the future. You have to measure the distance in bars between 2 swing lows or 2 swing highs, then take that number and multiply it by 1.618, the result is the projected pivot day. The first example on the chart is 34 bars x 1.1618 = 55.012 bars.

The formula provides the same ratio as a fib retracement tool - it is the same as measuring 0% to 38.2% and then to 100%

This approach is not without it's problems, it's often a day early, or a day late for example. Sometimes it will project a pivot that never materialises. Also, it is worth bearing in mind that not all rallies will show such a consist structure as the example I have given, some rallies exhibit a lot of sideways movement which could be a problem.

If you wanted to trade the pivots, you would need to devise a sensible method of confirmation. Also, filtering measured swings with a minimum amount of points is advisable. A sound knowledge and application of Elliot Wave Theory may help as well.

I am fascinated by this, but I don't trade it, I just don't have enough experience in PA to make it work. I advise newbies like myself to proceed with caution.

This will seem like a Grail hunt to some, and that this method is Esoteria at best. I accept there's potential for it to be a poisioned chalice, if you're not cautious enough, or experienced enough in PA and TA. On the other hand, if as traders we are willing to accept fib retracements are a useful measure of market price action development, then why not fibs on time?

Anyway, just putting this method out there for fun right now.

Looking forward to hearing about your methods HW - and apologies if this is actually your method - I certainly don't want to hijack your thread!
 

Attachments

  • bg_GRP.jpg
    bg_GRP.jpg
    301.1 KB · Views: 540
nice analysis, as per geo!

what's your success rate with it? by that i mean the ratio of clearly defined pivots to non pivots.
 
nice analysis, as per geo!

what's your success rate with it? by that i mean the ratio of clearly defined pivots to non pivots.

Hi Dr. B

It seems to me so far, from the few studies I have done, that about 25-30% projections give you an exact pivot day, approx 45 - 55% of projections are 1 or 2 days early or late of the pivot, with the remaining % being complete trash!

But, I have the benefit of hindsight, because I'm doing the analysis after the event, so I can see if there was a nice rally to measure, and choose to avoid analysing sideways action - so I can't be 100% how accurate these projections would be in reality, if you made them in realtime. Also, I don't have a swing filter rule to apply yet. Oh, and one more point, I am rounding up/down results to nearest whole numbers, which may skew the results further.

I think I might try using this method on a H4 chart soon, because it will be easier to deal with decimal places in the equations, as I'll be able to have fractions of hours - more accurate in theory than individual daily bars.

I looked at EUR/USD, through a sideways period during last year - you'll see there's a few good hits early on, but later the projections aren't so good. Hence need for sensible confirmation method.

Enjoy the rest of the weekend DB.
 

Attachments

  • eur_usd.jpg
    eur_usd.jpg
    210.8 KB · Views: 442
Last edited:
I had a quick look at the FTSE.

The projected pivot for the 7th May was one day early - not bad I guess.

Future projections I have shown are for the following dates:

26th may
4th June
8th June
22nd June
2nd July

There maybe revisions and new dates as new pivots are created. Anyway, lets see what happens :)

Sorry HW, I've taken over! ;)

p.s. everyone trade these at your own risk - but they're probably best left alone, until at least there is a decent confirmation and filter system in place, and the approach can be proved in realtime!

edit: I checked the chart, and one of the calcs on the chart is wrong - so now we have a new pivot projection for the 26th May - which is from the 30th March to the 21st April, i.e. 14 bars x 1.618 = 22.65, rounded upto 23, gives us the 26th.
 

Attachments

  • ft_time_2.jpg
    ft_time_2.jpg
    233.2 KB · Views: 451
Last edited:
Hi guys,
Just to let you know I have requested the formation of a new social group forum on timing the market. I asked in this thread:
http://www.trade2win.com/boards/general-trading-chat/62194-new-social-group-about-market-timing.html
I have gotten a nice response so for so I went ahead and put the request in already.
Not sure how long it will take to get it up and running, but when it is you guys are more than welcome to join.
Once the timing forum gets going I won't be posting any of my forecasts in the regular forums any more.

Geofract, it looks to me like you would be right at home with a thread of your own on the timing forum once it gets going. In fact I encourage you to put your name on the list for the timing forum and when its going start your very own thread on your forecasting method.
I can't make you do it :sneaky: but it would be great if you did.(y)

Also, once the timing forum gets started I'm going to make a sticky thread to explain pivots. From what I have seen most people don't understand them as well as they should to understand time cycles.
Just to give a hint some of your timing pivots that you think are off or no good actually are good.

Hope you have a great weekend.
 
I had a quick look at the FTSE.

The projected pivot for the 7th May was one day early - not bad I guess.

Future projections I have shown are for the following dates:

26th may
4th June
8th June
22nd June
2nd July

There maybe revisions and new dates as new pivots are created. Anyway, lets see what happens :)

Sorry HW, I've taken over! ;)

p.s. everyone trade these at your own risk - but they're probably best left alone, until at least there is a decent confirmation and filter system in place, and the approach can be proved in realtime!

edit: I checked the chart, and one of the calcs on the chart is wrong - so now we have a new pivot projection for the 26th May - which is from the 30th March to the 21st April, i.e. 14 bars x 1.618 = 22.65, rounded upto 23, gives us the 26th.

Not at all.
But you should have your own thread on the timing social group forum when it gets going.
You have something very good and easy here that I think other people would benefit from.
By the way this is not the method I use to forecast this market.
I will be explaining my method in the new social group forum.
 
interesting geo...no doubt speak to you tuesday if you're about. have a good wknd fella :)

EDIT:

new forum idea sounds good HW.
 
Not at all.
But you should have your own thread on the timing social group forum when it gets going.
You have something very good and easy here that I think other people would benefit from.
By the way this is not the method I use to forecast this market.
I will be explaining my method in the new social group forum.

Thanks for the very positive words HW!

I will certainly consider starting a thread of my own. I could introduce the concept, and if there was enough interest, I might be able to get other traders involved to help develop confirmation and filtering rules, etc. btw, I'm moving house in 1 wk, then it will take 10 days to get the interweb live again, so it can't happen quickly.

The thing is, whilst I understand a reasonable amount of theory, I've only been live trading for a few months. I have so much more to learn. So I wouldn't want to appear to be preaching to the more experienced.

Definately looking forward to understanding more about Pivots HW - your comment that some of those pivots I projected are good after all has defo got my attention.

Very much looking forward to reading your posts on the Social group thread soon. I will defo be an active player one way or another.

Have a good weekend.

Cheers, Geo

You are very welcome.
I think you would do well starting your own thread. Explain your method of forecasting and then make some forecasts with it.
I'm sure there are folks here who will be more than happy to help with creating a trading method/system with you.
I have used the 1.618 expansion for a while in price and time so it would be nice to have some one else working with it too. It seems to work well on the 15 minute chart for the gbp-usd.;)
Word has it that it could take a few weeks to get the social group forum up and going so don't worry about the move my good man. Fact is I just got done moving about a month ago myself! always fun:rolleyes:
Good luck with your move.
 
forgive my incredibly kak handed thoughts geo, but have you tried testing 1 bar pre or post the reversal date to start your calculations from?

just in the same principle of charting the Y-axis (price) which states that the bar AFTER the big event is the one to take your fib levels/S&R from (as they signal the start of the next cycle of sentiment as opposed to the big event which mark the end of the last move), maybe measurements on the X-axis have similar principles?

again, apologies for this simplistic input :)

Morning DB

Damn that is simplistic!!... I jest! ;)

I don't actually know about that approach on the Y-axis, but it definately would be worth a try on the X.

Where did you learn about that for the Y-axis DB? I would be curious to read up on that. I mean, I have read in passing about people making fib measures from the previous bar, but never subscribed to it myself.

What's your background DB btw?
 
There is an issue with finding a swing low/high when it is made up of more than 1 bar DB - your suggestion could be just the answer!
 
Morning DB

Damn that is simplistic!!... I jest! ;)

I don't actually know about that approach on the Y-axis, but it definately would be worth a try on the X.

Where did you learn about that for the Y-axis DB? I would be curious to read up on that. I mean, I have read in passing about people making fib measures from the previous bar, but never subscribed to it myself.

What's your background DB btw?

morgen geo,

re where the more crucial place to start measurements on the y-axis was from...just the simple book on TA i'm reading...and then testing/back testing the principle on the equities in my portfolio.

bit random, but i rationalised this information by visualising price swings as any large object subject to the laws of physics!

i.e. with a powerful movement in one direction (high velocity = more momentum) the price over-shoots what may be the markets true value. only after the swing overcomes the momentum would you get a more 'accurate' reading of the instruments status.

i'm a qualified sound engineer, i've been staring at sound waves for 14 years! i tend to look at charts as an oscilloscope, or as sound waves (where amplitude would be buying volume)...occupational hazard :)
 
Just a quick thought, and not to discount what you're suggesting DB, because I want to explore your idea, but...

If you throw a ball at the floor, and then it bounces up, where does the end of the down move and the start of up move occur? My answer would be at the same point in both space and time.

Perhaps this is bo**ocks though :whistling
 
Top