Head and Shoulders in the S&P

pennycapitalist

Junior member
Messages
39
Likes
15
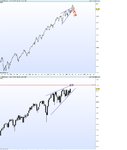
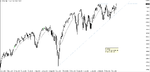
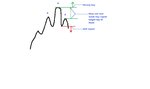
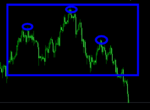
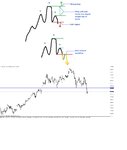
Hi traders, I was wondering if anyone else is seeing what I'm seeing in the major indices. I'm seeing a fully formed head and shoulders reversal pattern with an upwardly sloping neckline. If I'm not wrong, everything is there except a substantial dip below the neckline to confirm the pattern. The head is not as pronounced as some other head and shoulders formations, but it is higher than the peak of the first shoulder. Many of the head and shoulder's formations from the history books that marked major market turns had less defined heads than this one.

There are other signs as well, like the transportation stocks not doing as well as they should, even though tonnage is up. There is labor trouble on the west coast docks. Service industries are not doing great, and commodity prices are low in many cases.

There were nine distribution days until a couple dropped off. Six distribution days is a bad sign! There are, of course, conflicting signs, but aren't there always conflicting signs?

None of the talking heads are talking about this. There are always the bears predicting the sky is going to fall, but wouldn't those guys be shinning a light on a head and shoulders to prove their point?

Maybe I'm seeing things that aren't there. It is said that once you've seen a head and shoulders, that's all you see. Still, distribution days are real and if they are my imagination, I share the illusion with Investor's Business Daily.

Could some more experienced than me take a look and show me where I'm wrong, if I am.

Thank you,
Randy Cox
Pennycapitalist
 
I wished someone more skilled at TA would have looked at the chart and gave us an opinion, but it was not to be.

Now the confirmation dip below the neckline doesn't appear to be forthcoming, though these confirmations are often delayed. Still, if the market continues to rally as it appears to be doing, that would make the head and shoulders I saw a dud. Even if it fails, these kinds of false patterns usually happen only near the end of a bull market. Comments anyone?
 
If you want to make money trading forget of idiotic stuff such as head and shoulders. They are for losers.
 
If you want to make money trading forget of idiotic stuff such as head and shoulders. They are for losers.


Too sweeping - it depends how you trade the pattern. H&S are a useful pattern (Bulkowski rates them the best performing bear pattern in a bull trend) but the time to enter short is only after confirmation: then you will make money.

The S&P example is OK, but I'm seeing the right shoulder (23/03) only just below the head so maybe it was never likely to complete. Yes, I agree, a dying uptrend will see more bearish signals and most will not confirm.
 
SP500 weekly

i only see some kind of wedge
 

Attachments

  • SP500 wedge.jpg
    SP500 wedge.jpg
    129.9 KB · Views: 318
Thanks - this thread has made me a bit more alert to these patterns, which I don't generally pay any attention to and ceetainly don't trade off.

Of more interest in my own field is the more prolonged H&S in the GBP/JPY - left shoulder 19/09, head 05/12, right shoulder 26/02. Not confirmed yet. There is a steeply rising neckline, from 15/10 to 04/02, which is just now presenting resistance to price.
 

Attachments

  • GBP JPY.xlsx
    25.6 KB · Views: 270
The symmetry I saw in the S&P several days ago as printed in Investor's Business Daily doesn't seem to be there anymore and the S&P has had 3 straight gains as well as several distribution days dropping off. So the market seems to be in an uptrend...but there are still some negatives. I trade canslim which only works well in an uptrend. I'm testing shorter term methods for non-trending markets, but I'm in cash for now. The intraday Dow was interesting Friday.
 

Attachments

  • Dow intraday head and shoulders.doc
    315 KB · Views: 299
I do not see an H & S, I see a double top and a W pattern, first is a reversal the second is a continuation.
 

Attachments

  • sp.png
    sp.png
    22.7 KB · Views: 335
(Bulkowski rates them the best performing bear pattern in a bull trend) but the time to enter short is only after confirmation: then you will make money.

Has anyone checked Bulkowski? He never provided a method to check those patterns but only some numbers after he examined thousands of these patterns as he claimed. Should I take for granted that he was correct? I have seen more fake breakouts in H&S than profitable ones. It is a worthless patten based on my experience. I would change my mind in the face of a technical study that proves beyond doubt profitability of this pattern but only after checking the results. I think I am being reasonable.
 
I do not see an H & S, I see a double top and a W pattern, first is a reversal the second is a continuation.

The printed chart in IBD has a flat neckline, but your chart and the one I'm seeing in thinkorswim charts is not so straight.

Yep! I see that double top. If the first high of your double top was the top of a fat head and the bumps on either side of that head were shoulders, that was the head and shoulders I saw. The second top as you point out makes a double top which is also a bearish reversal pattern. However, we can see a pretty clear ascending triangle which is a bullish continuation pattern and a sign of accumulation. With volume growing a little and price up I'd say that was accurate.

Just like the fundamentals, the patterns are showing conflicting signals. If the market continues to go up, that would take out the double top and maybe signal more uptrend to come. Still the fundamentals send mixed signals. Some earnings are still up even with pressure from the strong dollar. Some earnings show struggle with that problem, and oil is either a problem...or a solution.

If I was younger I'd trade this market, but I can't afford a 15 or 20% correction. I think the positives outweigh the negatives for the moment, but I don't trust my own opinion enough to bet money on it.
 
Has anyone checked Bulkowski? He never provided a method to check those patterns but only some numbers after he examined thousands of these patterns as he claimed. Should I take for granted that he was correct? I have seen more fake breakouts in H&S than profitable ones. It is a worthless patten based on my experience. I would change my mind in the face of a technical study that proves beyond doubt profitability of this pattern but only after checking the results. I think I am being reasonable.

not worthless if you buy a "fake" sell :cool:

"A failed H&S pattern occurs when the price rallies above the high of the head after forming the right shoulder. When the price rallies above the head, make sure you quickly cut your losses if you are short because the move is usually strong if there were enough buyers to propel through all that resistance and set a new high. After getting through the resistance of the H&S pattern, the failed short setup often becomes a great long play. Here is an example of a failed H&S:"

http://www.morpheustrading.com/blog/trading-the-head-and-shoulders-chart-pattern/


http://www.investtech.com/main/mark...&tbReport=rptSignalStatIhsHs3Ose2014&lang=000
 

Attachments

  • HS.jpg
    HS.jpg
    42.8 KB · Views: 338
Dollar

Here's one on the current dollar 4 hour chart, Right shoulder also falls from the 50% Fib level, it tanked today and still has a lower target if you use the H&S.

It's also known as the Kenny Dalglish pattern, maybe aye, maybe naw :LOL:
 

Attachments

  • dol2.PNG
    dol2.PNG
    20.3 KB · Views: 295
Here's one on the current dollar 4 hour chart, Right shoulder also falls from the 50% Fib level, it tanked today and still has a lower target if you use the H&S.

It's also known as the Kenny Dalglish pattern, maybe aye, maybe naw :LOL:

Technically speaking the neckline should ideally be sloping up for topside reversals. . :smart:
 
The printed chart in IBD has a flat neckline, but your chart and the one I'm seeing in thinkorswim charts is not so straight.

Yep! I see that double top. If the first high of your double top was the top of a fat head and the bumps on either side of that head were shoulders, that was the head and shoulders I saw. The second top as you point out makes a double top which is also a bearish reversal pattern. However, we can see a pretty clear ascending triangle which is a bullish continuation pattern and a sign of accumulation. With volume growing a little and price up I'd say that was accurate.

Just like the fundamentals, the patterns are showing conflicting signals. If the market continues to go up, that would take out the double top and maybe signal more uptrend to come. Still the fundamentals send mixed signals. Some earnings are still up even with pressure from the strong dollar. Some earnings show struggle with that problem, and oil is either a problem...or a solution.

If I was younger I'd trade this market, but I can't afford a 15 or 20% correction. I think the positives outweigh the negatives for the moment, but I don't trust my own opinion enough to bet money on it.

Hi Penny

Just look at your post today and had another look at the daily chart, price is flirting with the high 2119.6 of the 25/2/15, a few bars went above but none closed above it.

Market are always nervous around those points...there is a bit of fight going on....
 
and not to forget the classic sell signal when (not always) neckline gets retested (and holds)
 

Attachments

  • HS retest.jpg
    HS retest.jpg
    134.4 KB · Views: 202
If the head and shoulders neckline is sloping upward, the investor can get out of the market with most of his capital. If the neckline is sloping downward, a large part of the reversal has already reduced his capital.
 
If the head and shoulders neckline is sloping upward, the investor can get out of the market with most of his capital. If the neckline is sloping downward, a large part of the reversal has already reduced his capital.

Yep true. Have all sorts of what they term 'complex' H&S patterns. After a while everything merges into a bowl of spaghetti.

42711.jpg


:eek::-0:eek::-0:eek::-0:eek:


.
 
Top