You are using an out of date browser. It may not display this or other websites correctly.
You should upgrade or use an alternative browser.
You should upgrade or use an alternative browser.
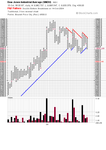
Dangerous triangle
- resistance just below 10000
ChartMan said:Some easy pickings today, especially off 64... + the divergences.
- resistance just below 10000
Attachments
TraderTony
Active member
- Messages
- 180
- Likes
- 1
Monday 18th October 2004
A real sickener today for me - missed all the good trades and took all the bad ones. 6 losers out of 7 is just good enough...
11:00 1) S 9854. Late entry and hits support at 9850 to send it back into loss. Bad start having missed much better entry earlier.
11:04 EXIT: -5. A truly awful trade to kick off the week. Actually marked reversal in market with PD on CCI and RSI to the long side.
12:21 2) L 9933. Very late into the move again. Went +9 then ran out of steam and reversed sharply. Making a balls up of today so far.
12:29 EXIT: -1.
I've taken 2 trades at the extremes of the move (in the wrong direction) and missed the whole gap closing run up in between!
13:09 3) L 9930. Try again but it's gone flat now. Again, moved a few in profit but no follow through to lock in profits. Crept to +11 at HOD then giving it all back.In such a quiet period +11 at double top would have been a good target/exit. But amazingly it did creep up further.
13:34 EXIT +11.
14:24 4) L 9915 from the 100 ema but market very flat and emas very flat. Absolutely no follow through.
14:30 EXIT -2.
34 ema definitely doing a better job of dictating the trend today than the 100 ema (34 ema on 3 minute chart acts as a proxy for 100 ema on a 1m chart).
15:03 5) L 9933 (again). Absolutely no movement after entry. Not encouraging. Hoping for a break up from bull flag but looks like another loser.
15:05 EXIT -5 straight out. Horrible. Fake out - should still be in.
15:09 6) L 9937. How stupid is this. Getting whipped to death here. A very expensive few minutes to ruin the day.
15:12 EXIT -10. Dreadful.
15:30 7) L 9950. And yet again I'm chasing after a big movement. This is where the 3m chart really causes me problems. A spectacularly bad last hour.
15:32 EXIT -10.
-22 from 7
-29 for day including commissions
+110 for October so after commissions
Attachments
Bad numbers expected today. Oil on it´s way back up & probably testing new highs in a nearby future. ES04Z might have topped (1120-1122max). DAX about to give in. Guess we are close to a top if we haven´t been there already. Had FTSE at 46654670. Am short in some stocks - guess we have done the back testing of TLs so it doesn´t look too good now. Enough suckers having bought calls and they pull the carpet...
week so far
Hi,
Total score for last week +171.5 IB Dow points.
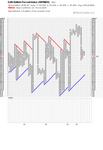
Mid to late last week, collected 6 longs (see chart). Closed 2 of them this AM for +12, +49.5. The remaining 4 are -68, -46, -24 and -5 so far today.
For #1, #2 ... saw 5 wave ending and thought this was C wave of an ABC corrective off the highs. When the subsequent bounce hit the territory of the previous 4th wave of lesser degree, I should have taken profits but didn't. *1. I thought the next drop was 5 waves (it wasn't) and likely to be 5th wave (my C wave turned into a 3rd wave here🙂, I thought, #3.) Again bounced up to the top of the previous 4th wave territory; should definitely have taken profits here but didn't.
On Wednesday and Thursday, doubled my exposure with 3 more longs, #4,#5,#6. At first thought the decline on Wednesay morning was a 3 wave B wave for a higher degree consolidation but it was only the first leg of an ending diagonal, this therefore was an ending 5th wave of 5 series or C wave of 3:3:5 ABC from the highs at 10260.
Being fully exposed (actually overexposed ... got carried away ... AGAIN), I should have taken profits (perhaps 50%) at 9980 with that 3 wave bounce especially as 5 min TA was overbought and adx was still dropping, but I didn't. *2.
Market went down again late Friday and most of yesterday as a 5 wave which now is likely to be the 5th wave of an extended 3rd wave from the highs at 10260.
This latest bounce from yesterday's lows looks to have more upside by TA but we're at the upper end of the previous 4th wave territory of lesser degree. Because the 3rd wave extended these bounces can go up to the 2nd wave territory, so looking for 10020 to 10120.
I'll be looking to close at least half of my remaining longs around 10000 to 10020. Closing progressive 50% of positions is something I've learnt here ... it works well, I think by ensuring profits taken and reducing risk.
Summary from last week and this so far .... DON'T BE GREEDY, take what the market offers rather than a preset goal and DON'T OVEREXPOSE.
BTW, MarketVolume reckon yesterday's high resistive volume (although total daily volume was down) was just a delayed reaction to all the supportive volume collected over the last couple of weeks.
This directly contradicts the Ewavers who believe that after a short term bounce (maybe finishing this week) the market will head much lower.
It'll be interesting to see who's right.
Good luck today everyone.
Hi,
Total score for last week +171.5 IB Dow points.
Mid to late last week, collected 6 longs (see chart). Closed 2 of them this AM for +12, +49.5. The remaining 4 are -68, -46, -24 and -5 so far today.
For #1, #2 ... saw 5 wave ending and thought this was C wave of an ABC corrective off the highs. When the subsequent bounce hit the territory of the previous 4th wave of lesser degree, I should have taken profits but didn't. *1. I thought the next drop was 5 waves (it wasn't) and likely to be 5th wave (my C wave turned into a 3rd wave here🙂, I thought, #3.) Again bounced up to the top of the previous 4th wave territory; should definitely have taken profits here but didn't.
On Wednesday and Thursday, doubled my exposure with 3 more longs, #4,#5,#6. At first thought the decline on Wednesay morning was a 3 wave B wave for a higher degree consolidation but it was only the first leg of an ending diagonal, this therefore was an ending 5th wave of 5 series or C wave of 3:3:5 ABC from the highs at 10260.
Being fully exposed (actually overexposed ... got carried away ... AGAIN), I should have taken profits (perhaps 50%) at 9980 with that 3 wave bounce especially as 5 min TA was overbought and adx was still dropping, but I didn't. *2.
Market went down again late Friday and most of yesterday as a 5 wave which now is likely to be the 5th wave of an extended 3rd wave from the highs at 10260.
This latest bounce from yesterday's lows looks to have more upside by TA but we're at the upper end of the previous 4th wave territory of lesser degree. Because the 3rd wave extended these bounces can go up to the 2nd wave territory, so looking for 10020 to 10120.
I'll be looking to close at least half of my remaining longs around 10000 to 10020. Closing progressive 50% of positions is something I've learnt here ... it works well, I think by ensuring profits taken and reducing risk.
Summary from last week and this so far .... DON'T BE GREEDY, take what the market offers rather than a preset goal and DON'T OVEREXPOSE.
BTW, MarketVolume reckon yesterday's high resistive volume (although total daily volume was down) was just a delayed reaction to all the supportive volume collected over the last couple of weeks.
This directly contradicts the Ewavers who believe that after a short term bounce (maybe finishing this week) the market will head much lower.
It'll be interesting to see who's right.
Good luck today everyone.
Attachments
Last edited:
tradesmart
Experienced member
- Messages
- 1,286
- Likes
- 22
Friday:-
Good to know that the crystal ball is still working, and I love it when a plan comes together... 😉
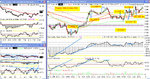
Evidence again that several apparent attempts to ‘rally’ may fail before one takes off, and the current upleg on the 4hr chart is based on a familiar divergent pattern between price and RSI/CCI that delivers consistently………
On the 1hr chart, divergence has deceptively built up over many days before finally delivering what may be an appreciable move, and could the top of the 4hr channel be in the sights…..?!
Futs now up 40-50points supporting the bulls…..
I suspect that the foray north today is just triple-witching Friday bounce that will soon collapse to equal or exceed the recent lows, with the possibility of forming a short term ‘bottom’…………..
Good to know that the crystal ball is still working, and I love it when a plan comes together... 😉
Evidence again that several apparent attempts to ‘rally’ may fail before one takes off, and the current upleg on the 4hr chart is based on a familiar divergent pattern between price and RSI/CCI that delivers consistently………
On the 1hr chart, divergence has deceptively built up over many days before finally delivering what may be an appreciable move, and could the top of the 4hr channel be in the sights…..?!
Futs now up 40-50points supporting the bulls…..
Attachments
chump said:Crikey GKB can you actually read that chart 😉 ?
Hi Chump,
Sorry about the chart. Once clicked, you should be able to double the view to a high resolution picture.
I've tried (honest) but I can't seem to get the charts any smaller and clear. Could anyone please advise?
Ta.
Graham
Sell Signal!?
Looks like a sell signal in the major US-indexes.
Asian indicies all on sell except Australia. (HangSeng, Nikkei, Kospi) as well as DAX & FTSE - tomorrow telcos, insurers and maybe banks will get hammered. AH not looking good either;
http://data.island.com/ds/data/topl...edshares&order=asc&html=true&ah=true&rows=100
Attachments
Last edited:
GKB,
yeah man the chart is awful, can't see , well I use prophet too, and the way to do it is click on tools and print chart , this will give another window with an option as landscape or portrait, then click on landscape and you will se eyour chart in adf format, then you click on the disk icon save button , and save on your local PC. Once saved you can drag and drop it on here for everyone here to view..let me know if you have any problems
yeah man the chart is awful, can't see , well I use prophet too, and the way to do it is click on tools and print chart , this will give another window with an option as landscape or portrait, then click on landscape and you will se eyour chart in adf format, then you click on the disk icon save button , and save on your local PC. Once saved you can drag and drop it on here for everyone here to view..let me know if you have any problems
sall said:here is my example I was in and out for a short while today
Nice and clear , Sall, but it takes ages to open up Adobe 6..... try saving as a GIF perhaps....
ChartMan said:Nice and clear , Sall, but it takes ages to open up Adobe 6..... try saving as a GIF perhaps....
Thanks Sall and CM,
Heaven knows why I'm having problems ... but here goes. Trying 2 charts below, as Gif and Pdf.
All comments gratefully received🙂
Graham
Attachments
See Below,
It seems that the pdf format is clearer. CM, I have transferred to gif file but as you can see, it's as bad as before. In fact you can see the gif file in all it's glory, only if you zoom on the chart ... but that's a hassle and no-one else has that problem.
So, do I use pdf ... and thereby lose the thumb size preview?
or
do I use gif ... and rely on people to zoom in on the image?
Decisions, decisions
HELP.
Graham