Johnny Nevada
Junior member
- Messages
- 14
- Likes
- 0
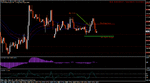
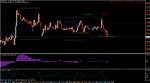
My system of trading has rarely failed me, but over the past 5 to 6 weeks I've taken a beating. In most scenarios, my trades have been stopped-out only to then come back and hit my original profit targets.
Can anyone, is there anyone who is willing, to help me in my situation?--or at least point me to the right resources?
Attached is a screenshot of my latest chart. I would most sincerely, most appreciatively, give my thanks to those who are willing to help.
Thank you in advance.
Most respectfully,
J.
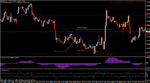