Charting the levels

trader_dante

Veteren member
Messages
4,535
Likes
1,535
I wanted to start this thread because Potential Setups has turned into a "pin bar free for all".

No idea how many times I have to say that market participants make decisions based on whether they perceive value in a price because of a host of fundamental / technical reasons and the candlestick patterns are really only a clue as to what way we might move.

I am keen to start a thread that attempts to chart important levels, giving reasons as to why they are important but actually leaving the entry down to the individuals criteria.

Traders can then look to play the levels in ways that they are comfortable with: choosing perhaps to enter based off of clues in the order flow or the candlesticks or the volume or their indicators or a whole host of other reasons on ANY timeframe they like.

In short, lets leave the ENTRY out of it and concentrate on the whereabouts.

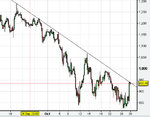
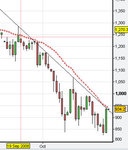
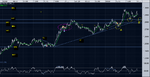
I've started with what I think will be a strong area of support in the Soybean market.
 

Attachments

  • soybeans.gif
    soybeans.gif
    16.4 KB · Views: 513
S&P futures rallied into strong resistance on a 4hr chart today, potential overnight entry. Same picture on the daily charts and has rallied into the 21ma. Deffo short IMO
 

Attachments

  • sp500.jpg
    sp500.jpg
    43.9 KB · Views: 317
  • sp5002.jpg
    sp5002.jpg
    30.2 KB · Views: 298
Last edited:
GBP/USD 1 hour.

Area of confluence:

1) Hourly S/R pivot zone

2) Rising TL

3) 50% fib from swing low to swing high.
 

Attachments

  • gbp.gif
    gbp.gif
    20.5 KB · Views: 478
GBP/USD 1 hour.

Before it gets there :)

GBP/USD currently trading in an area containing 38.2 of last major downswing, 123.6 of last failed bearish move and monthly S3 pivot, also in the "resistance band" provided by emas 21,34 & 55.
 

Attachments

  • gb1.gif
    gb1.gif
    21.9 KB · Views: 300
  • gb2.gif
    gb2.gif
    21.2 KB · Views: 265
The gbpusd 4hr chart shown shows the next significant previous swing lows circled in green that may act as resistance. (SBR) the swing lows show on the 1hr/4hr/daily chart.

Not a great deal in terms of previous swings on 1hr chart+ ahead of that, above the current price, there are however some fibs that include the 61.8% 7516-5265 @ 6654, 23.6% longer 1162-5565 @ 6649, and 61.8% of 7634-5265 @ 6730. Others include 38.2% of the 8668-5265 fall @ 6553, and 23.6% of 0832-5265 @ 6565.

The area circled in red shows the previous swing hi (this fairly minor swing shows better on 1hr chart [pullback highs last weds] ) at which cable found resistance at today's current intraday hi, sufficient for an 80pip pullback, the area also being around the 23.6% fib of the fall from 0397.

G/l
 

Attachments

  • 4hr gbpusd.gif
    4hr gbpusd.gif
    13.5 KB · Views: 286
Hi Folks,

To me, S and R work like magic...
The 5 min Eur-Usd chart attached has quite a few lines on it, just focus on SR2, SR4 and T2 for key levels.
T2 was drawn on the chart this morning but...
See how the price reacted off the intersection of T2 and SR4 at around mid-day? Fantastic.

Also, as I type, SR2 and T2 intersection has produced a reaction bounce as well !!!

But now here's the kicker...I drew SR4 YESTERDAY whilst trading inside the purple oval.

S and R.... best tools in the box.

Best Regards,
Neil
 

Attachments

  • LEVELS.PNG
    LEVELS.PNG
    46.3 KB · Views: 331
Neil, are your S/R levels drawn by sight or are they calculated pivot points (e.g. S1, S2 etc)?

Tom
 
The gbpusd 4hr chart shown shows the next significant previous swing lows circled in green that may act as resistance. (SBR) the swing lows show on the 1hr/4hr/daily chart.

Not a great deal in terms of previous swings on 1hr chart+ ahead of that, above the current price, there are however some fibs that include the 61.8% 7516-5265 @ 6654, 23.6% longer 1162-5565 @ 6649, and 61.8% of 7634-5265 @ 6730. Others include 38.2% of the 8668-5265 fall @ 6553, and 23.6% of 0832-5265 @ 6565.

The area circled in red shows the previous swing hi (this fairly minor swing shows better on 1hr chart [pullback highs last weds] ) at which cable found resistance at today's current intraday hi, sufficient for an 80pip pullback, the area also being around the 23.6% fib of the fall from 0397.

G/l

Hi bbmac,

Do you find the 23.6% reliable? I've always ignored it in favour of the "bigger" levels of the 38, 50 and 61.

Also, do you use fib extensions? I ignore these...

Tom
 
The chart attached is the 1hr gbpusd chart, cable finding early london/european session resistance at that previous very minor swing lo on 1hr circled in green (SBR)

Levels above and below current market price are:
The areas shown as points A B and C are previous 1hr swing Highs that may offer support on a re-test, areas A and B twice tested as Resistance. (potential RBS)

Area D is another minor 1hr swing Lo that may act as Resistance(potential SBR,) particularly given that the current intraday hi area found resistance at such a minor 1hr swing lo. The area D falls in that 4hr/daily previous swing low 6787-6887 detailed and shown in post 5 above.

There is also probably a minor 1hr ascending support trend line that I haven't drawn in yet, as well as fibs from the moves up from 5265 etc..

G/L
 

Attachments

  • gbpusd 1hr levels.gif
    gbpusd 1hr levels.gif
    20.5 KB · Views: 285
This is what I am looking at in the Cable.


Confluence of:

1) Round number 1.60

2) Rising TL - should come into 1.60 by this time this pulls back there (if indeed it does)

3) 50% fib level of swing low to recent high

4) S/R pivot

It all comes together in the blue zone.
 

Attachments

  • gbp.gif
    gbp.gif
    25.5 KB · Views: 375
Hi bbmac,

Do you find the 23.6% reliable? I've always ignored it in favour of the "bigger" levels of the 38, 50 and 61.

Also, do you use fib extensions? I ignore these...

Tom

Hi Tom

Sorry didn't see your Q above...I have the 23.6/38.2/50/76.4 fib levels drawn but generally find the 3 you mention, particularly the 50 and 61.8 the ones to look out for. the other 2 can be useful particularly if part of a confluence of potential supp/res/sbr/rbs factors. Like you I don't tend to use the extensions.

Re your gbpusd chart/analysis in post 12, Thanks, yeh that looks a potentially strong confluence area you have highlighted.
 
The chart attached is the 1hr gbpusd chart, cable finding early london/european session resistance at that previous very minor swing lo on 1hr circled in green (SBR)

Levels above and below current market price are:
The areas shown as points A B and C are previous 1hr swing Highs that may offer support on a re-test, areas A and B twice tested as Resistance. (potential RBS)

Area D is another minor 1hr swing Lo that may act as Resistance(potential SBR,) particularly given that the current intraday hi area found resistance at such a minor 1hr swing lo. The area D falls in that 4hr/daily previous swing low 6787-6887 detailed and shown in post 5 above.

There is also probably a minor 1hr ascending support trend line that I haven't drawn in yet, as well as fibs from the moves up from 5265 etc..

G/L

Update re area A in analysis above, cable found support at the bottom of that potential RBS zone provided by the previous 1hr swing hi,...a 90+ pip bounce at time of writing has ensued....screenshot of the zone at pouint A is attached. The area was also the 61.8% fib of the 6246-today's hi move 6671 area.

(more on the zones provided by the previous swing hi/lo's in the 4th attachment here: http://www.trade2win.com/boards/for...comprehensive-trading-system-methodology.html)
 

Attachments

  • 1hr gbpusd area A on above chart.gif
    1hr gbpusd area A on above chart.gif
    8.5 KB · Views: 209
Update re area A in analysis above, cable found support at the bottom of that potential RBS zone provided by the previous 1hr swing hi,...a 90+ pip bounce at time of writing has ensued....screenshot of the zone at pouint A is attached. The area was also the 61.8% fib of the 6246-today's hi move 6671 area.

(more on the zones provided by the previous swing hi/lo's in the 4th attachment here: http://www.trade2win.com/boards/for...comprehensive-trading-system-methodology.html)

The area A above providing a couple of intraday bounces as it acts as support...a previous swing hi area on 1hr chart tested twice whose 'zone' on closer inspection runs 6472-6407 and incorporates;
50% 6264-6671 @ 6467
61.8% of above @ 6419
23.6% 5539-6671 @ 6407

below this the zone around area B in screenshot above runs 6342-6299 again a twice tested previous 1hr swing hi that includes the 23.6% of 5265-6671 @6341.

Inbetween these potential RBS zones is the 76.4% of the 6264-6671 swing @ 6361

G/L
 
I trade everything my firm will give me a limit in. At the moment that is Gbp, Euro, Yen, Crude, Dow, Eurostoxx, FTSE, Bund, T-Note, Wheat and hopefully going to get Gold, Silver, Corn and Soya added soon.
 
does anyone actualy trade something other than fx on this site?


Genics:......Even in this thread trader_dante has shown a potential area on soyabeans, and in gbpusd. The areas in gbpusd that I decsribed today have seen a 200, 100 and 70 pip bounce up as they acted as Support (RBS) and now area B decsribed above has seen a 30pip bounce at time of writing.
 
Genics, I am very happy to talk about the grains if you like...I've got a lot of time for Grains traders. Beautiful market :)
 
Top