Interceptor
Member
- Messages
- 99
- Likes
- 1
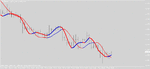
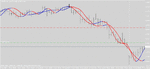
I've been backtesting the FTSE, using two moving averages and looking at crossovers for entries and exits. I was laboring under the illusion that, once an average was 'cemented' in place, it didn't move again(as with price). I was mortified this morning to discover that, for the preceding 12 hours or so at least, this is not the case.
My question is, how can you refine a methodology looking for MA crossover setups, when the most recent history is constantly being rewritten?
My question is, how can you refine a methodology looking for MA crossover setups, when the most recent history is constantly being rewritten?