Chart Reading

PaddyDublin

Newbie
Messages
7
Likes
0
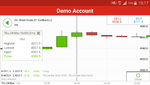
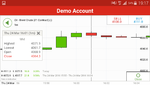
I am trying to become familiar with reading historic candlestick charts. I must be reading them incorrectly because:

a) I am seeing that regardless of what resolution I am looking at, the closing price on one candlestick does not equal the opening price of the next

b) if I change resolution, prices seem to change. For example, if I look at any particular candlestick - let's say I am looking at 30min resolution and I pick the closing price on the candlestick for 12pm - if I change resolution to 1min and again go for the closing price on the 12pm candlestick, I see a different price.

I'm sure I must be looking at the charts incorrectly but cannot figure out what I'm doing wrong. Can anyone help explain both these questions?

Thanks, Paddy.
 
Hi Paddy, ill try to help...Ok the candle is telling you 5 things, 1. the opening price. 2. the highest the price went to, 3. the lowest the price went to 4. the closing price and 5. the colour. This denotes whether price has closed higher or lower than it opened, usually red for lower and green for higher....Known as OHLC, open high low close.

with some small cap share prices with limited liquidity you can often see gapping between the candles,

Thanks for that Mike. But how do you account for the fact that the closing price on one stick does not equal the opening price on the next? And why does resolution affect prices?

I ought to warn you that I'm an accountant and thus I get very anxious and upset when an opening balance doesn't equal the previous close. But maybe traders see things differently for some reason?
 
what chart are you looking at paddy, if you look at a major forex chart for example gbp/usd then the prices should follow on from each candle...because its being constantly traded.

if you are looking at a share price chart, then there maybe times where no shares were traded, thus giving you a "gap" between the last and current candles....hope that makes sense..
 
Perhaps an example would help me explain. In the two pictures:

The first shows a closing price of 4068.5 at 16:00 today
The second shows an opening price of 4068.9 at 16:01 today

How can it be that the 16:00 closing price is not the same as the 16:01 opening price? How does this discrepancy arise?
 

Attachments

  • tmp_17998-Screenshot_2016-03-24-19-17-12-445723770.png
    tmp_17998-Screenshot_2016-03-24-19-17-12-445723770.png
    157.9 KB · Views: 218
  • tmp_17998-Screenshot_2016-03-24-19-17-22-2079688896.png
    tmp_17998-Screenshot_2016-03-24-19-17-22-2079688896.png
    158.8 KB · Views: 177
That's because between them, nanoseconds, price is moving and the lowest granularity this chart goes to is minutes or even seconds
 
That's because between them, nanoseconds, price is moving and the lowest granularity this chart goes to is minutes or even seconds

Thanks. I'm not disagreeing with you - this is pretty much the same conclusion I came to. I guess it's a capacity limitation of this particular chart I'm looking at? It's taken from the ig.com android app. Possibly a more "professional" chart would not have such breaks in prices? I don't know the answer to that as I've never seen a high-end professional chart.
 
ok, that shows a price gap of 3 points. in that particular minute the next traded price was 3 points higher. Is that a ig demo ? remember spreadbetting brokers just mirror the real price, i.e make their own prices up, they probably just shafted someone out of a couple of K's...:LOL:
 
Thanks. I'm not disagreeing with you - this is pretty much the same conclusion I came to. I guess it's a capacity limitation of this particular chart I'm looking at? It's taken from the ig.com android app. Possibly a more "professional" chart would not have such breaks in prices? I don't know the answer to that as I've never seen a high-end professional chart.
It's not important so don't worry about it. Good luck with your trading.
 
I am like to look the chart patern also, in my view this simpler than use many kinds indicator that only making complicated in view, as long as understand what to do, chart patern still profitabe i think
 
Thanks. I'm not disagreeing with you - this is pretty much the same conclusion I came to. I guess it's a capacity limitation of this particular chart I'm looking at? It's taken from the ig.com android app. Possibly a more "professional" chart would not have such breaks in prices? I don't know the answer to that as I've never seen a high-end professional chart.

An instrument does not need to 'trade' (i.e. a buyer and seller transact at a given level) for price to move.

E.g. market might be 9/10, last trade at 9, if the 10 offer pulls his order and the 9 bid then moves up to 10 we now have a 10/11 market, if someone then pays 11 we have had a 9 print followed by an 11 print and one of your gaps on a chart.
 
The initial question of this topic raised something I've long wanted to ask. What kind of stock trading happens between day trades, and why isn't it shown on charts like tradingview? I mean, such "night" trades is the reason why close price and next day's open price differ, am I right?
 
The initial question of this topic raised something I've long wanted to ask. What kind of stock trading happens between day trades, and why isn't it shown on charts like tradingview? I mean, such "night" trades is the reason why close price and next day's open price differ, am I right?

The agreed-upon price of the last transaction between a buyer and seller at the close of any given session does not obligate the buyer and seller in the first transaction of the following session to agree upon the same price.

Db
 
Top